1. The Visualization
Insert your visualization here.
Section I. Understanding the elderly population of the UK and the world
Additional features I would like to add but cannot achieve due to limited coding skills:
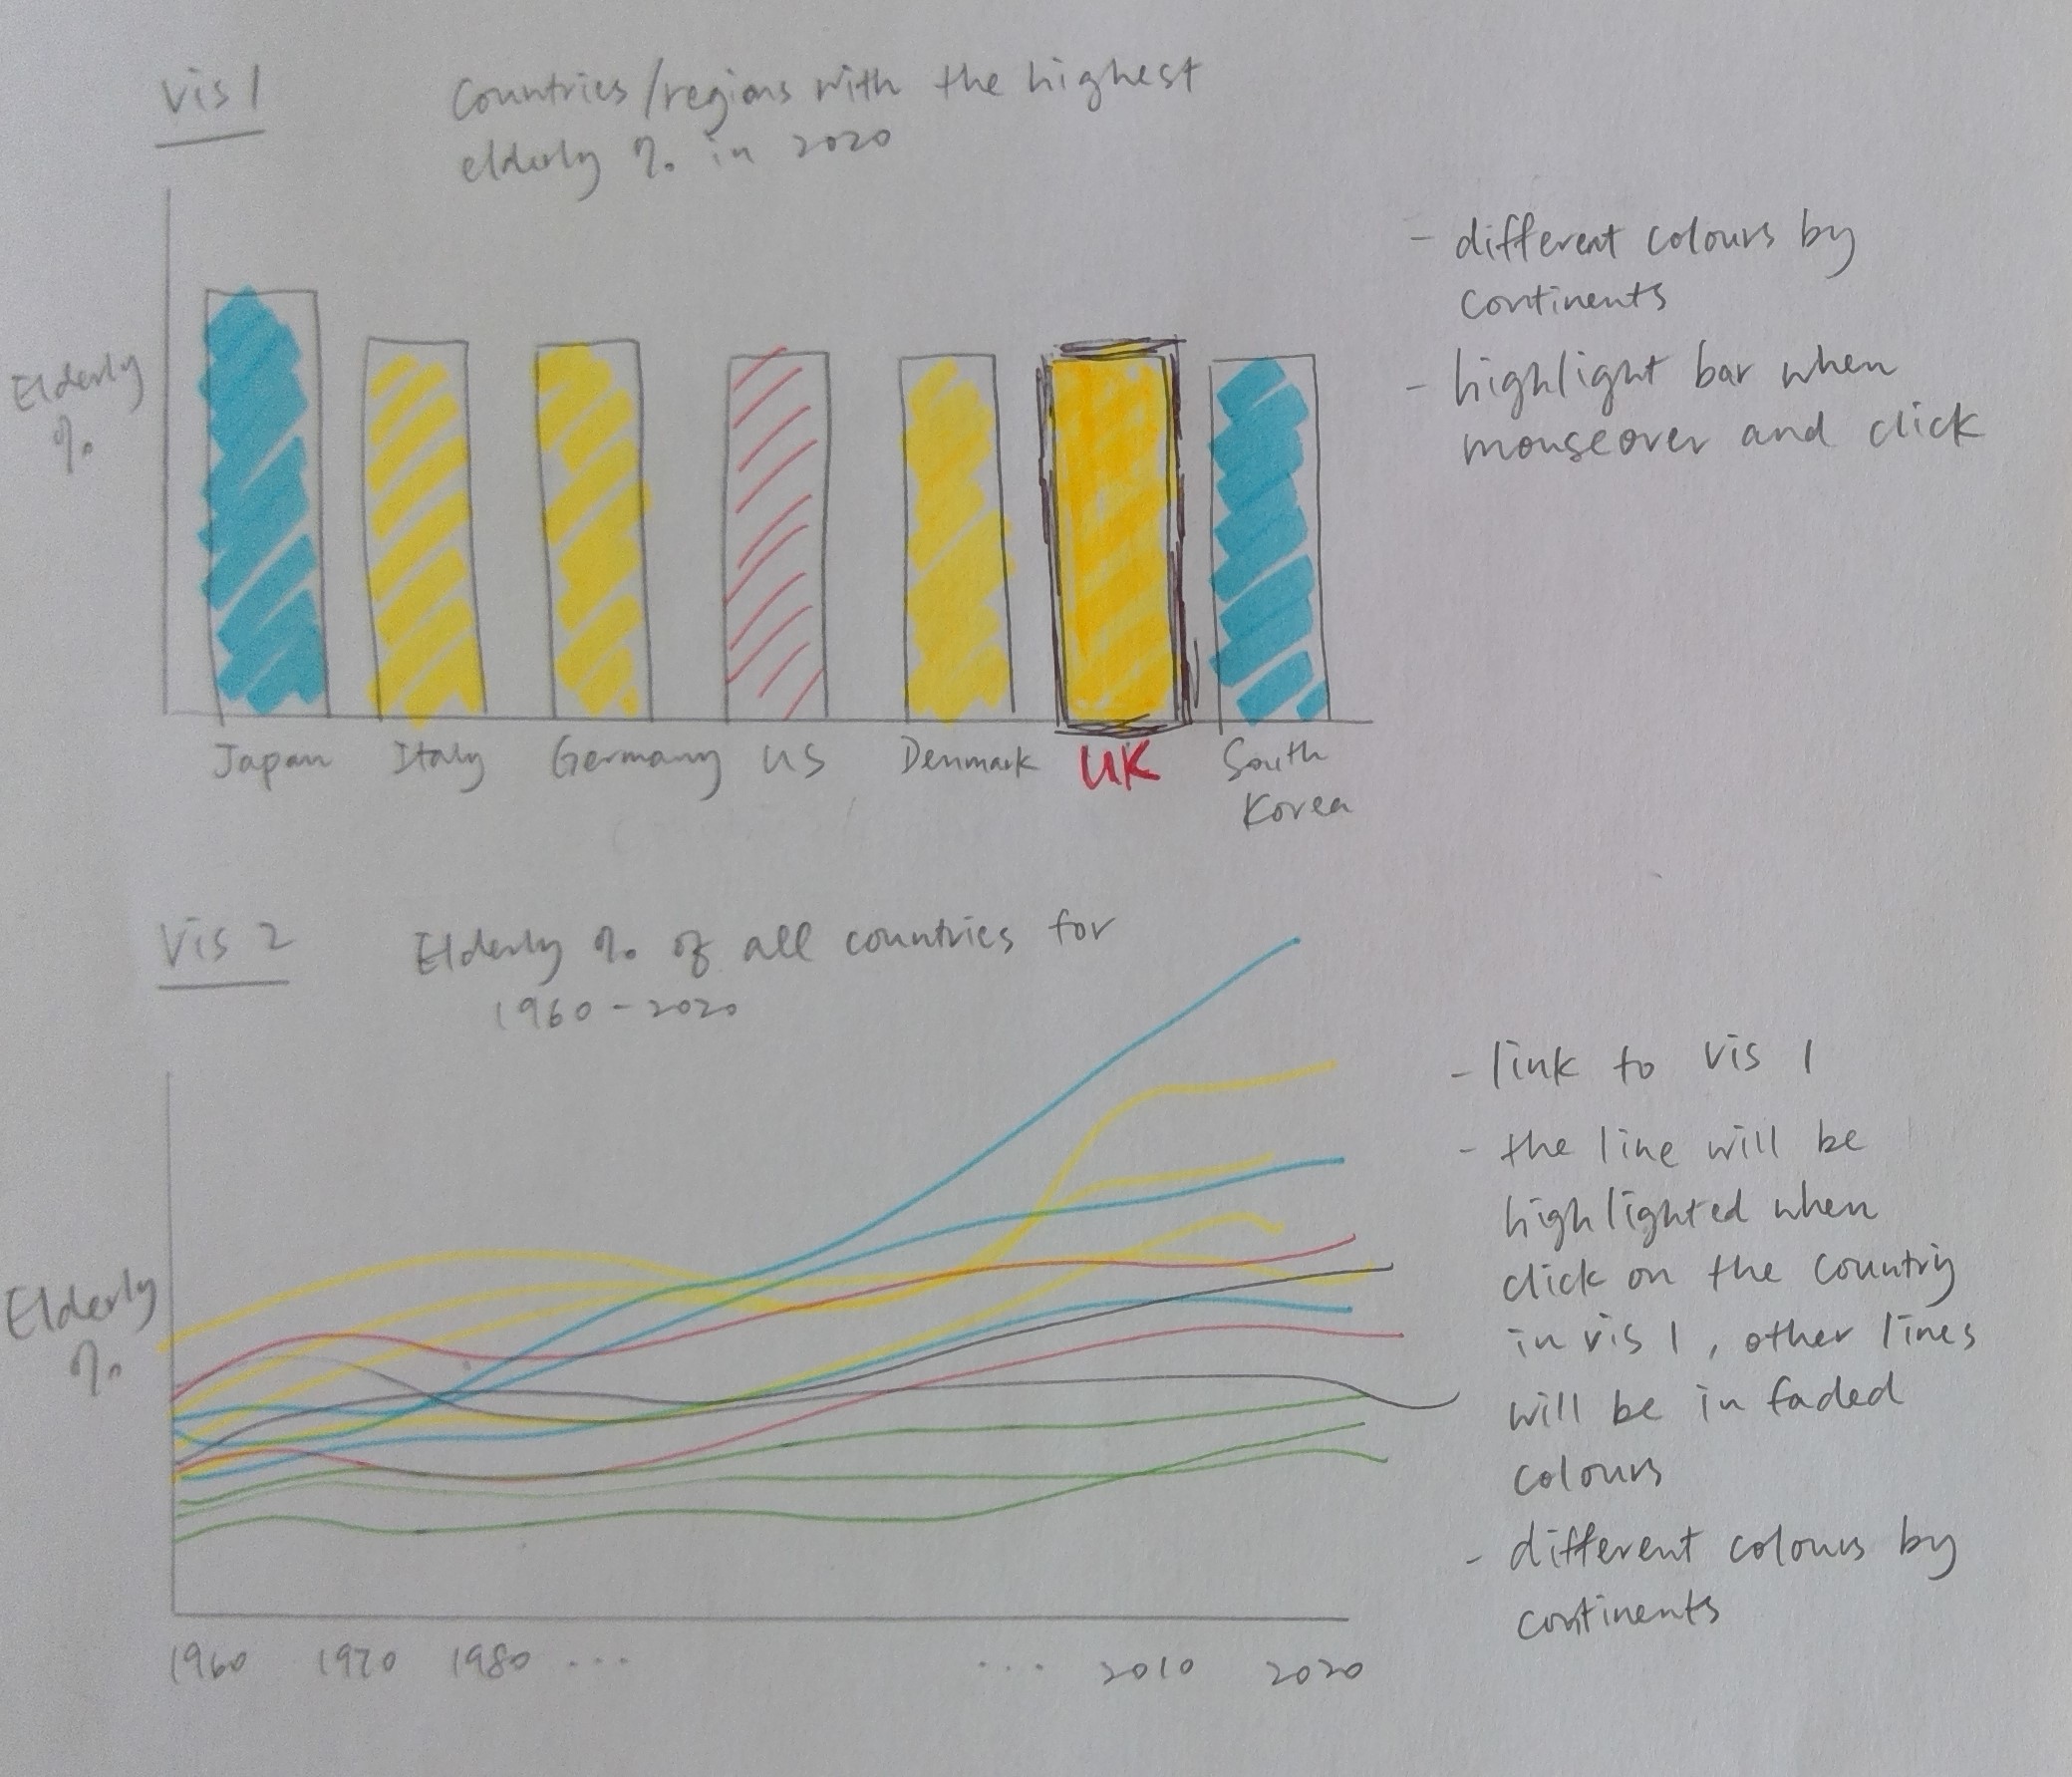
- Highlight the label "United Kingdom" in another colour (e.g. red) and bold it to bring attention to user.
Additional features I would like to add but cannot achieve due to limited coding skills:
-
Apply linked interaction for vis 1 and 2 so that when user click on vis 1 and select a country, the line of the same country (40-year trend) will be highlighted in vis 2. Due to time contraints, I used radio button for user to select the top 30 countries with the highest percentage of elderlies as substitution.
-
Add colour to the lines so that different colours apply to different continents in synchronise with vis 1. User can identify the distribution of elderlies by continents easily from colours and align with vis 1 e.g. light blue for Asia, light orange for Europe. These colours should be in opacity 0.1 unless the specific country is selected in vis 1 and switch to opacity 1.
-
Intented sketches:
Section II. Understand the UK population by age group
Additional features I would like to add but cannot achieve due to limited coding skills:
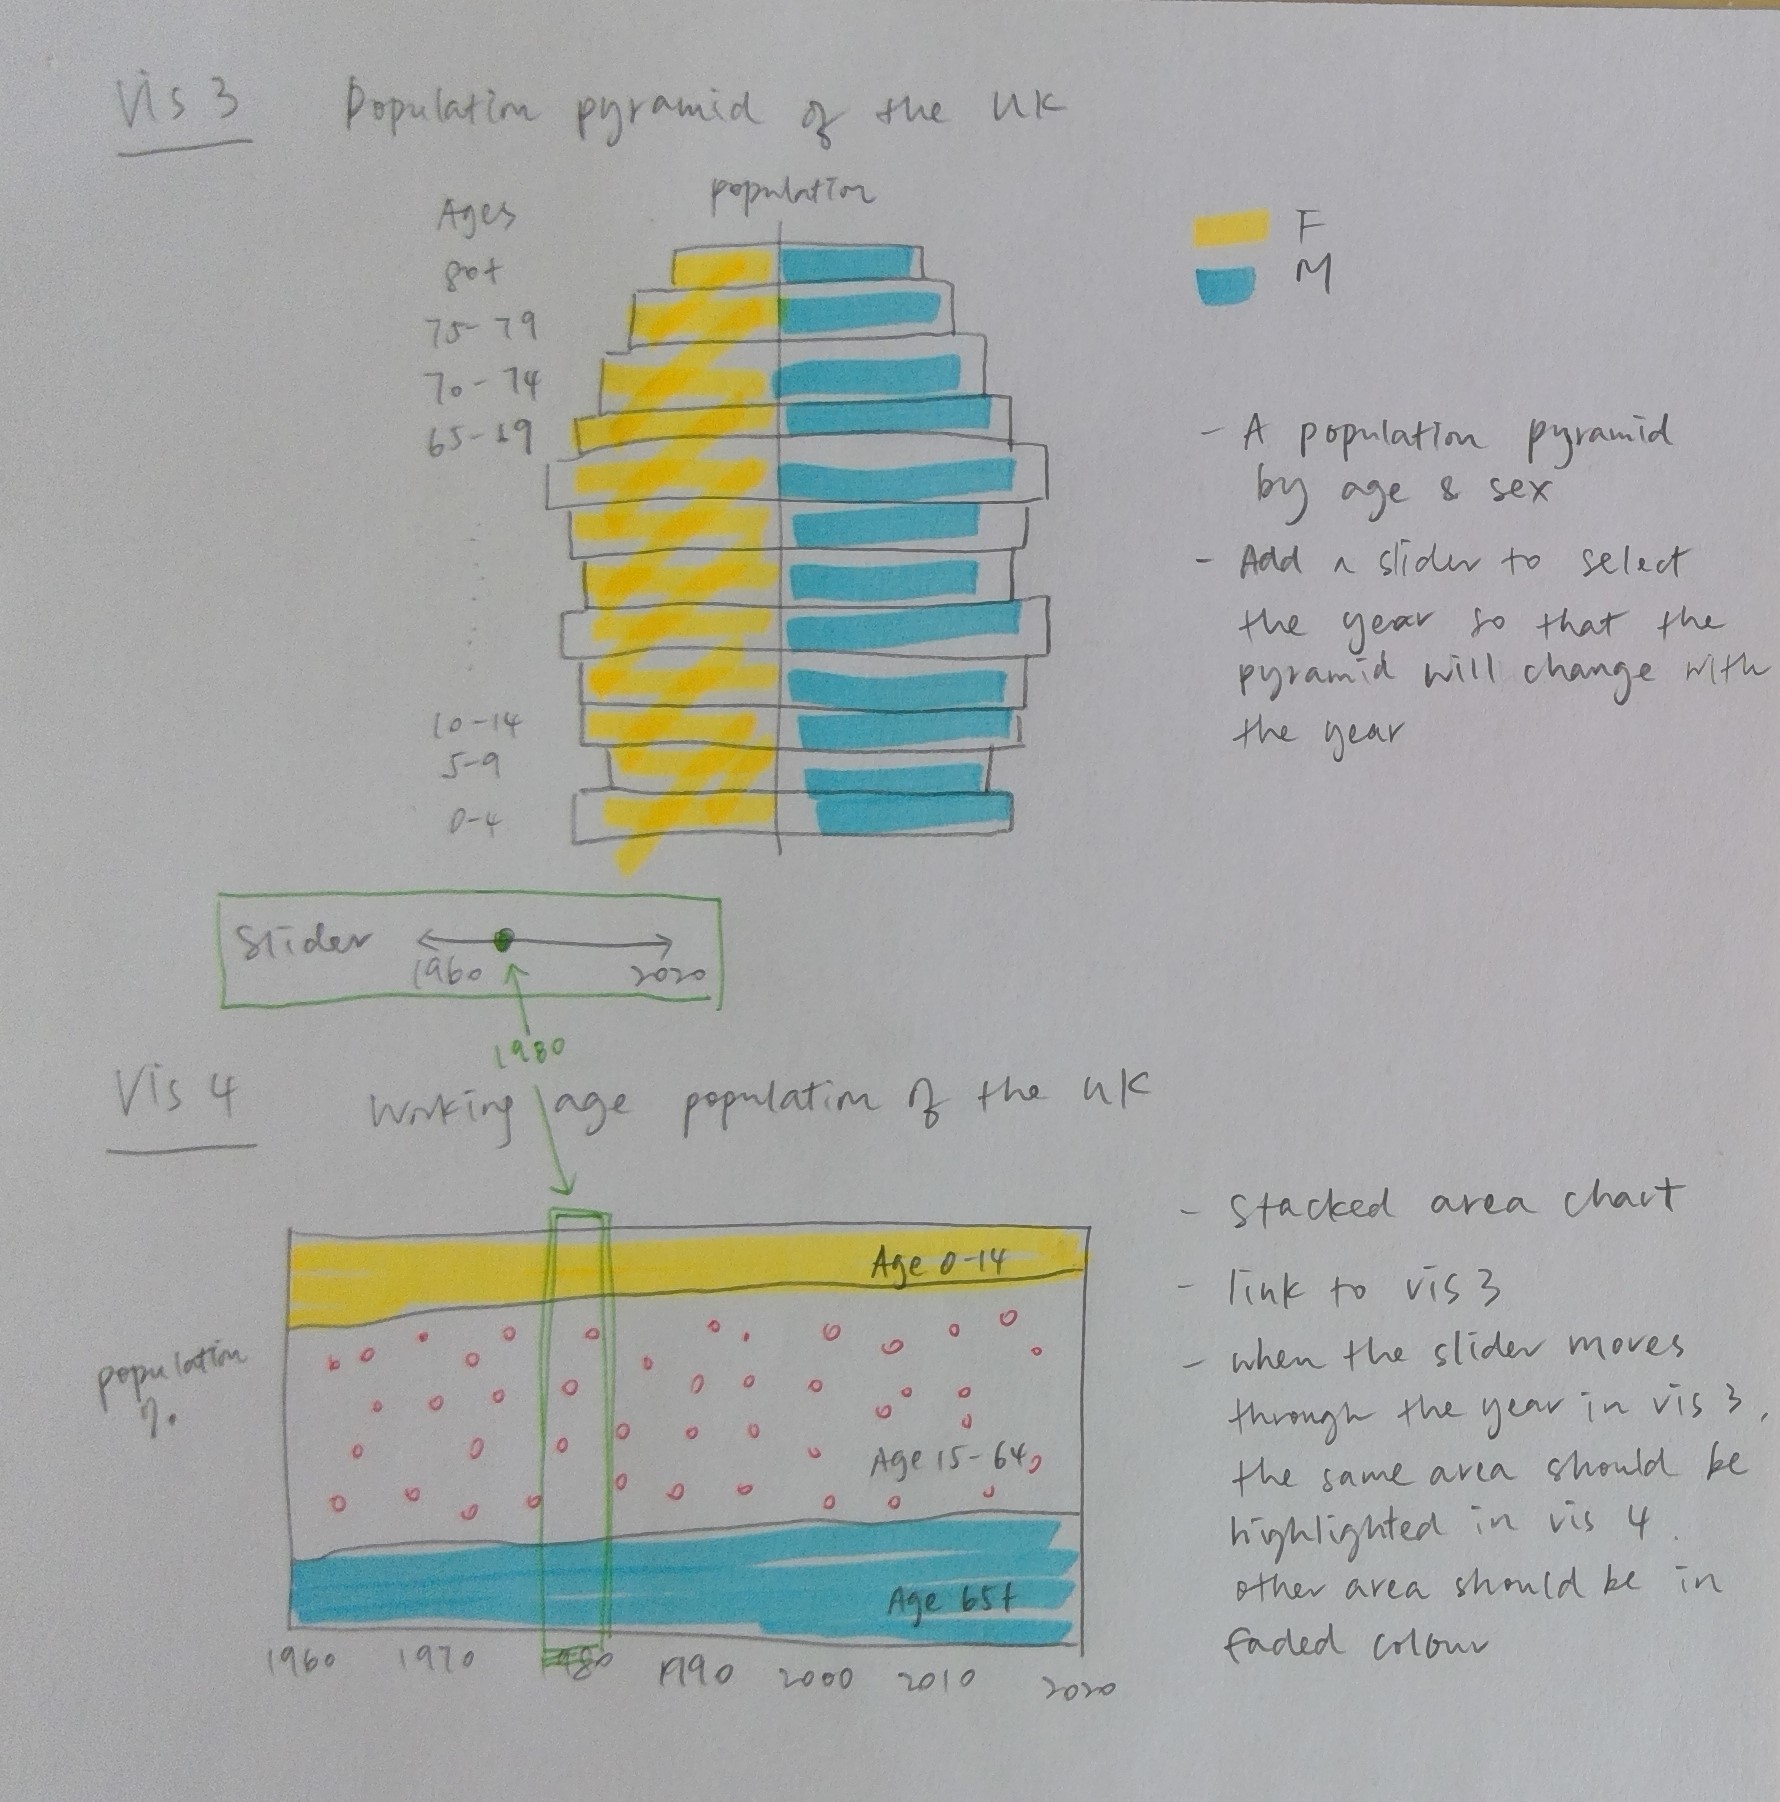
- Vis 3: Remove "ages" in the y-axis label and put it in y-axis title instead. I tried to remove "ages" from the datasource table but the data column becomes number and cannot be read by litvis as categorical data. I have to keep "ages" in the labels in order to visualise the chart.
- Vis 4: Link the interaction of vis 3 to v4 so that when user slide through the year in the slider in vis 3, the area of the same year will be highlighted in vis 4 while the other years will be slightly greyed out.
- Vis 4: Put the age group label inside the area chart instead of a legend at the side.
- Intented sketches:
{"$schema":"https://vega.github.io/schema/vega-lite/v5.json","width":600,"height":250,"config":{"view":{"stroke":null},"axis":{"ticks":false,"domain":false}},"data":{"url":"https://ngayuho.github.io/data/world_age_65plus_top30.csv"},"params":[{"name":"highlight","select":{"type":"point","on":"mouseover"}},{"name":"select","select":"point","value":29}],"encoding":{"x":{"field":"country_name","sort":{"encoding":"y","order":"descending"},"axis":{"title":""}},"y":{"field":"pop_percent_65plus","type":"quantitative","axis":{"title":"Population %","values":[10,20],"format":".0f"}},"fillOpacity":{"condition":{"param":"select","value":1},"value":0.4},"strokeWidth":{"condition":[{"param":"select","empty":false,"value":2},{"param":"highlight","empty":false,"value":1}],"value":0},"color":{"field":"continent","legend":{"labelLimit":0}},"tooltip":[{"field":"pop_percent_65plus","format":".2f","title":"Population %"}]},"mark":{"type":"bar","stroke":"black","cursor":"pointer"}}
{"$schema":"https://vega.github.io/schema/vega-lite/v5.json","width":600,"height":400,"config":{"view":{"stroke":null}},"data":{"url":"https://ngayuho.github.io/data/world_age_65plus.csv"},"encoding":{"x":{"field":"year","type":"temporal","axis":{"title":""}},"y":{"field":"pop_percent_65plus","type":"quantitative","title":"Percentage of population over age 65 (%)","axis":{"title":"Population %","values":[10,20],"format":".0f"}},"color":{"condition":{"param":"mySelection","empty":false,"field":"country_name","scale":{"scheme":"reds"},"legend":null},"value":"grey"},"opacity":{"condition":{"param":"mySelection","empty":false,"value":1},"value":0.1},"tooltip":[{"field":"country_name","title":"Country/Region"},{"field":"pop_percent_65plus","format":".2f","title":"Population %"}]},"params":[{"name":"mySelection","bind":{"input":"radio","name":"UK & Top 30 Countries/Regions:","options":["United Kingdom","Japan","Italy","Portugal","Finland","Greece","Germany","Bulgaria","Malta","Croatia","Puerto Rico","France","Slovenia","Latvia","Lithuania","Virgin Islands (U.S.)","Estonia","Sweden","Denmark","Hungary","Czech Republic","Netherlands","Spain","Belgium","Romania","Austria","Croatia","Switzerland","Serbia","Poland","Hong Kong SAR, China"]},"select":{"type":"point","fields":["country_name"]}}],"mark":"line"}
{"$schema":"https://vega.github.io/schema/vega-lite/v5.json","width":400,"config":{"view":{"stroke":null}},"data":{"url":"https://ngayuho.github.io/data/ukpopulation.csv"},"params":[{"name":"yearSlider","value":1960,"bind":{"input":"range","name":"Year","min":1960,"max":2020,"step":1}}],"transform":[{"filter":"year(datum.year) == yearSlider"}],"encoding":{"x":{"field":"population","title":"Population","aggregate":"sum","axis":null,"stack":"center"},"y":{"field":"agegroup","title":"","sort":"descending","axis":{"domain":false,"ticks":false,"offset":20}},"color":{"field":"sex","legend":{"labelLimit":0},"scale":{"scheme":"set1"}},"tooltip":[{"field":"population","format":",","title":"Population"}]},"layer":[{"mark":{"type":"bar","opacity":0.6}},{"transform":[{"filter":"year(datum.year) == yearSlider"}],"mark":{"type":"bar","opacity":0}}]}
{"$schema":"https://vega.github.io/schema/vega-lite/v5.json","width":500,"height":300,"data":{"url":"https://ngayuho.github.io/data/workgroupformat.csv"},"encoding":{"x":{"field":"year","timeUnit":{"unit":"yearmonth"},"axis":{"title":"","format":"%Y"}},"y":{"field":"population","type":"quantitative","title":"Population %","stack":"normalize"},"color":{"field":"series","scale":{"scheme":"set2"},"legend":{"labelLimit":0}},"tooltip":[{"field":"year","type":"temporal","format":"%Y","title":"Year"},{"field":"series","title":"Age group"},{"field":"population","format":",","title":"Population"},{"field":"pop_percent","format":".2f","title":"Population %"}]},"mark":"area","config":{"view":{"stroke":null}}}