"""
System Status tab: unified view of tracker status, energy budget,
control replay, fruiting zone monitor, and ROI dashboard.
Five sections accessible via sub-tabs within a single page.
"""
from __future__ import annotations
import json
import logging
from datetime import date, datetime, timedelta, timezone
from pathlib import Path
from typing import Optional
import pandas as pd
import streamlit as st
from config import settings
logger = logging.getLogger(__name__)
def render_tab_system_status() -> None:
st.header("System Status")
# Live vineyard camera
import streamlit.components.v1 as _components
_components.html(
"""
 """,
height=280,
)
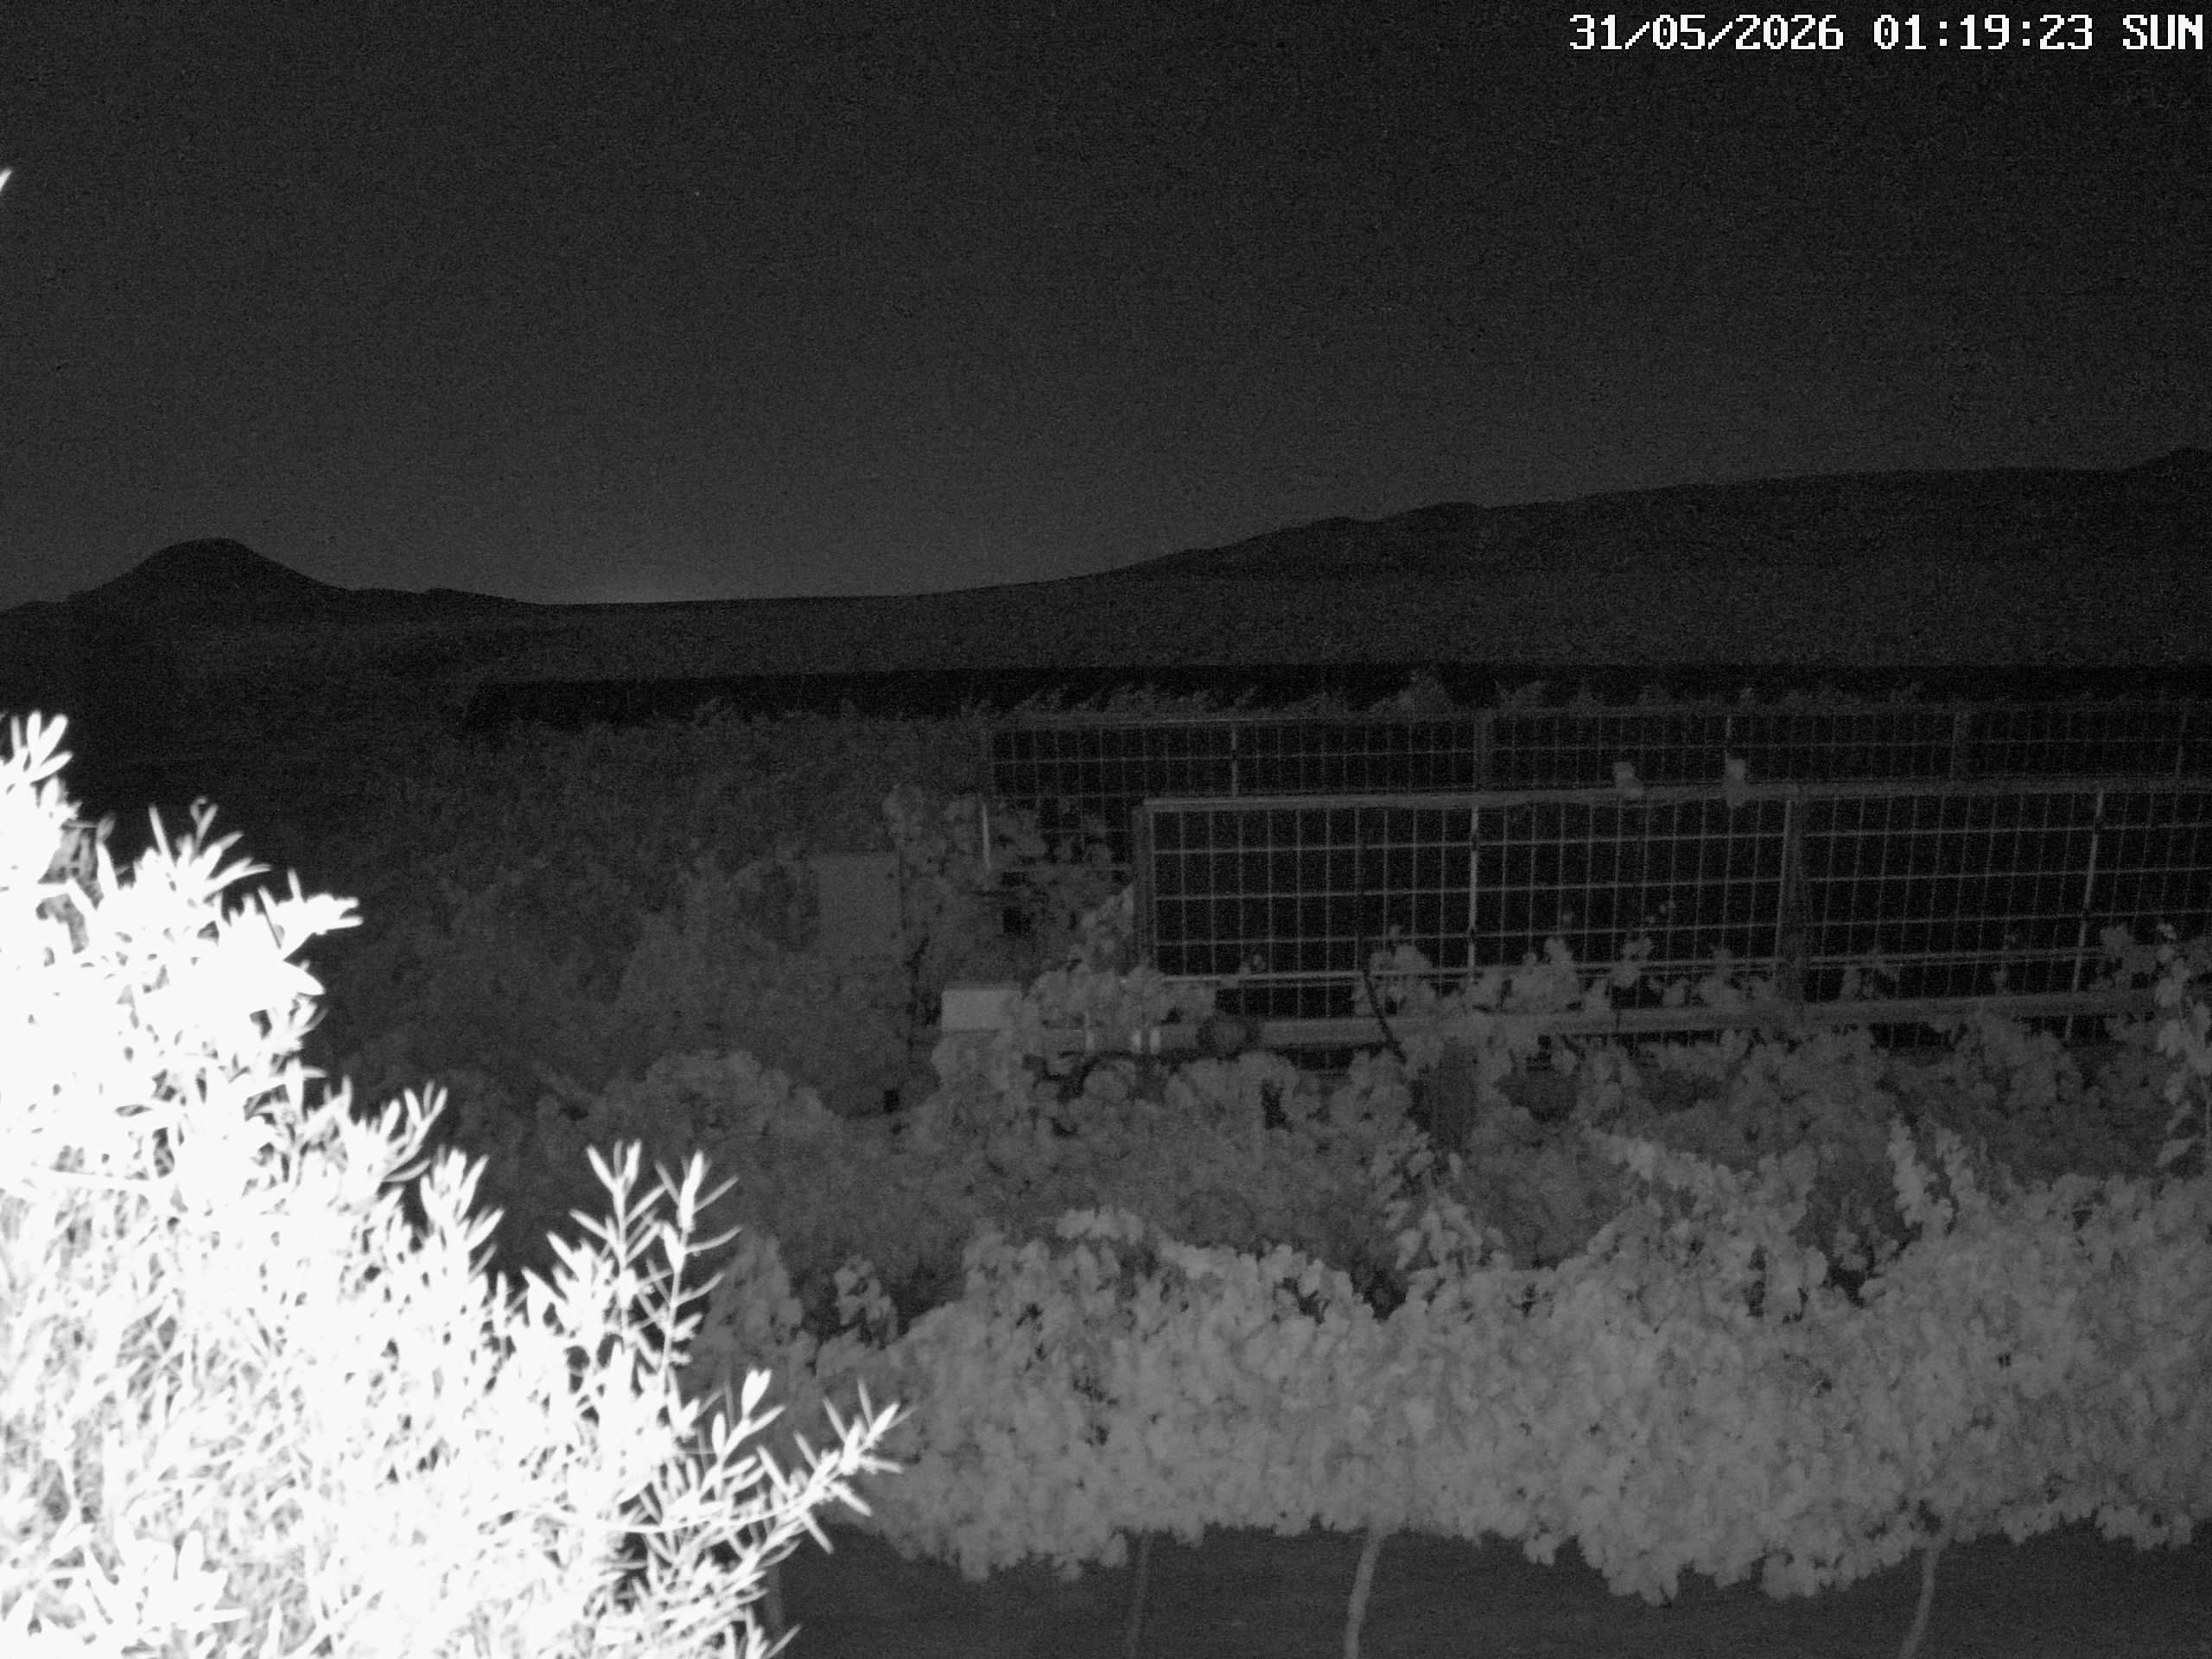
st.caption(
"Live vineyard camera — Yeruham, Israel. "
"_If the view shows only sky, the on-site camera needs realignment._"
)
st.divider()
section = st.radio(
"Section",
[
"Tracker Status",
"Energy Budget",
"Control Replay",
"Fruiting Zone",
"ROI Dashboard",
],
horizontal=True,
label_visibility="collapsed",
)
if section == "Tracker Status":
_render_tracker_status()
elif section == "Energy Budget":
_render_energy_budget()
elif section == "Control Replay":
_render_control_replay()
elif section == "Fruiting Zone":
_render_fruiting_zone()
elif section == "ROI Dashboard":
_render_roi_dashboard()
# ======================================================================
# 1. Tracker Status
# ======================================================================
def _get_tracker_data():
"""Fetch live tracker angles and attributes from ThingsBoard."""
cache_key = "sys_tracker_data"
cache_ts_key = "sys_tracker_ts"
now = datetime.now(tz=timezone.utc)
# 5-second cache
if cache_key in st.session_state:
cached_ts = st.session_state.get(cache_ts_key)
if cached_ts and (now - cached_ts).total_seconds() < 5:
return st.session_state[cache_key]
try:
from src.tracker_dispatcher import TrackerDispatcher
dispatcher = TrackerDispatcher(dry_run=True)
angles = dispatcher.read_current_angles()
st.session_state[cache_key] = angles
st.session_state[cache_ts_key] = now
return angles
except Exception as exc:
logger.warning("Failed to fetch tracker data: %s", exc)
return None
def _render_tracker_status():
st.subheader("Tracker Status")
st.caption("Live panel angles and control state from ThingsBoard.")
angles = _get_tracker_data()
if angles is None:
st.warning("Could not connect to ThingsBoard. Check credentials.")
return
cols = st.columns(len(angles))
for col, (name, angle) in zip(cols, angles.items()):
with col:
display_name = name.replace("Tracker", "T")
if angle is not None:
st.metric(display_name, f"{angle:.1f}°")
else:
st.metric(display_name, "offline")
# Angle comparison chart
valid = {k: v for k, v in angles.items() if v is not None}
if valid:
try:
import plotly.graph_objects as go
fig = go.Figure()
names = list(valid.keys())
vals = list(valid.values())
colors = ["#2196F3" if abs(v - vals[0]) < settings.ANGLE_TOLERANCE_DEG
else "#FF5722" for v in vals]
fig.add_trace(go.Bar(
x=[n.replace("Tracker", "T") for n in names],
y=vals,
marker_color=colors,
text=[f"{v:.1f}°" for v in vals],
textposition="outside",
))
fig.update_layout(
yaxis_title="Angle (°)",
yaxis_range=[0, max(vals) * 1.3 + 5],
height=300,
margin=dict(t=20, b=40),
)
st.plotly_chart(fig, key="tracker_angles_chart")
except ImportError:
df = pd.DataFrame({"Tracker": list(valid.keys()),
"Angle (°)": list(valid.values())})
st.dataframe(df, hide_index=True)
# Coherence check
if len(valid) >= 2:
vals = list(valid.values())
spread = max(vals) - min(vals)
if spread > settings.ANGLE_TOLERANCE_DEG * 2:
st.warning(
f"Tracker spread is {spread:.1f}° — some trackers may be "
f"out of sync (tolerance: {settings.ANGLE_TOLERANCE_DEG}°)."
)
else:
st.success(f"All trackers aligned within {spread:.1f}°.")
if st.button("Refresh", key="refresh_trackers"):
for k in ["sys_tracker_data", "sys_tracker_ts"]:
st.session_state.pop(k, None)
st.rerun()
# ======================================================================
# 2. Energy Budget
# ======================================================================
def _render_energy_budget():
st.subheader("Energy Budget")
st.caption(
f"Hierarchical shading budget — max {settings.MAX_ENERGY_REDUCTION_PCT}% "
f"of annual PV generation."
)
from src.energy_budget import EnergyBudgetPlanner
planner = EnergyBudgetPlanner()
today = date.today()
annual = planner.compute_annual_plan(today.year)
# Annual overview
total_potential = annual["total_potential_kWh"]
annual_budget = annual["total_budget_kWh"]
reserve = annual["annual_reserve_kWh"]
c1, c2, c3 = st.columns(3)
c1.metric("Annual PV Potential", f"{total_potential:,.0f} kWh")
c2.metric("Shading Budget (5%)", f"{annual_budget:,.0f} kWh")
c3.metric("Emergency Reserve", f"{reserve:,.0f} kWh")
# Monthly breakdown
monthly = annual.get("monthly_budgets", {})
if monthly:
month_names = {
5: "May", 6: "Jun", 7: "Jul", 8: "Aug", 9: "Sep",
}
months = sorted(monthly.keys())
labels = [month_names.get(m, str(m)) for m in months]
values = [monthly[m] for m in months]
try:
import plotly.graph_objects as go
colors = []
for m in months:
w = settings.MONTHLY_BUDGET_WEIGHTS.get(m, 0)
if w >= 0.4:
colors.append("#FF5722")
elif w >= 0.1:
colors.append("#FF9800")
else:
colors.append("#4CAF50")
fig = go.Figure(go.Bar(
x=labels, y=values,
marker_color=colors,
text=[f"{v:.1f}" for v in values],
textposition="outside",
))
fig.update_layout(
yaxis_title="Budget (kWh)",
height=300,
margin=dict(t=20, b=40),
title_text="Monthly Shading Budget Allocation",
)
st.plotly_chart(fig, key="monthly_budget_chart")
except ImportError:
df = pd.DataFrame({"Month": labels, "Budget (kWh)": values})
st.dataframe(df, hide_index=True)
# Weekly plan for current week
with st.expander("This Week's Budget"):
try:
# compute_weekly_plan needs monthly_remaining; derive from annual
current_month = today.month
monthly_budget = monthly.get(current_month, 0.0)
weekly = planner.compute_weekly_plan(today, monthly_remaining=monthly_budget)
st.json(weekly)
except Exception as exc:
st.info(f"Weekly plan unavailable: {exc}")
# ======================================================================
# 3. Control Replay
# ======================================================================
def _load_sim_logs() -> list[Path]:
log_dir = settings.SIMULATION_LOG_DIR
if not log_dir.exists():
return []
return sorted(log_dir.glob("*.json"), reverse=True)
def _render_control_replay():
st.subheader("Control Replay")
st.caption("Step through historical control loop decisions slot by slot.")
log_files = _load_sim_logs()
# Also check for in-memory tick log
sources = {}
if log_files:
for f in log_files[:10]:
sources[f.stem] = f
if not sources:
_today_iso = date.today().isoformat()
_week_ago_iso = (date.today() - timedelta(days=7)).isoformat()
st.info(
"No simulation logs found. Run the simulation script:\n\n"
f"```\npython scripts/run_control_simulation.py --start {_week_ago_iso} --end {_today_iso}\n```"
)
return
selected = st.selectbox("Log file", list(sources.keys()), key="replay_log_select")
path = sources[selected]
with open(path) as f:
ticks = json.load(f)
if not ticks:
st.warning("Empty log file.")
return
# Surface log freshness — sim logs are historical replays, but if the latest
# one is >30 days old it almost certainly means no fresh sim has been run.
file_age_days = (
date.today()
- date.fromtimestamp(path.stat().st_mtime)
).days
if file_age_days > 30:
st.warning(
f"⚠ This log is **{file_age_days} days old** "
f"(generated {date.fromtimestamp(path.stat().st_mtime).isoformat()}). "
f"Run `python scripts/run_control_simulation.py` to generate a fresh replay."
)
# Extract sim window from first/last tick timestamps for an honest caption.
_ts_first = ticks[0].get("timestamp", "") if ticks else ""
_ts_last = ticks[-1].get("timestamp", "") if ticks else ""
_sim_range = ""
if isinstance(_ts_first, str) and isinstance(_ts_last, str) and _ts_first and _ts_last:
_sim_range = f" · simulated {_ts_first[:10]} → {_ts_last[:10]}"
st.caption(f"{len(ticks)} ticks loaded from `{path.name}`{_sim_range}")
# Date filter
days = sorted(set(t.get("sim_day") or str(t.get("timestamp", ""))[:10] for t in ticks))
if len(days) > 1:
sel_day = st.select_slider("Day", days, key="replay_day")
ticks = [t for t in ticks if (t.get("sim_day") or str(t.get("timestamp", ""))[:10]) == sel_day]
# Summary metrics
interventions = sum(1 for t in ticks if (t.get("plan_offset_deg") or 0) > 0)
overrides = sum(1 for t in ticks if t.get("live_override"))
dispatched = sum(1 for t in ticks if t.get("dispatch"))
c1, c2, c3, c4 = st.columns(4)
c1.metric("Ticks", len(ticks))
c2.metric("Interventions", interventions)
c3.metric("Live Overrides", overrides)
c4.metric("Dispatched", dispatched)
# Timeline chart
try:
import plotly.graph_objects as go
from plotly.subplots import make_subplots
times = []
angles = []
offsets = []
temps = []
ghis = []
for t in ticks:
ts = t.get("timestamp", "")
if isinstance(ts, str) and ts:
try:
times.append(datetime.fromisoformat(ts))
except ValueError:
times.append(None)
else:
times.append(None)
angles.append(t.get("target_angle", 0))
offsets.append(t.get("plan_offset_deg", 0) or 0)
temps.append(t.get("air_temp_c"))
ghis.append(t.get("ghi_w_m2"))
valid_times = [t for t in times if t is not None]
if valid_times:
fig = make_subplots(
rows=3, cols=1, shared_xaxes=True,
subplot_titles=("Target Angle", "Plan Offset", "Temperature"),
vertical_spacing=0.08,
row_heights=[0.4, 0.3, 0.3],
)
fig.add_trace(go.Scatter(
x=valid_times, y=angles[:len(valid_times)],
mode="lines", name="Target angle (°)",
line=dict(color="#2196F3"),
), row=1, col=1)
fig.add_trace(go.Bar(
x=valid_times, y=offsets[:len(valid_times)],
name="Offset (°)",
marker_color=["#FF5722" if o > 0 else "#E0E0E0"
for o in offsets[:len(valid_times)]],
), row=2, col=1)
valid_temps = [t if t is not None else float("nan")
for t in temps[:len(valid_times)]]
fig.add_trace(go.Scatter(
x=valid_times, y=valid_temps,
mode="lines", name="Temp (°C)",
line=dict(color="#FF9800"),
), row=3, col=1)
fig.add_hline(
y=settings.SEMILLON_TRANSITION_TEMP_C, row=3, col=1,
line_dash="dash", line_color="red",
annotation_text=f"{settings.SEMILLON_TRANSITION_TEMP_C}°C",
)
fig.update_layout(height=600, margin=dict(t=40, b=20), showlegend=False)
st.plotly_chart(fig, key="replay_timeline")
except ImportError:
pass
# Slot-by-slot detail
with st.expander("Slot Details"):
slot_idx = st.slider("Slot", 0, len(ticks) - 1, 0, key="replay_slot")
tick = ticks[slot_idx]
cols_display = {
"timestamp": "Time",
"slot_index": "Slot",
"target_angle": "Target Angle (°)",
"plan_offset_deg": "Plan Offset (°)",
"live_override": "Live Override",
"override_reason": "Override Reason",
"source": "Source",
"dispatch": "Dispatched",
"air_temp_c": "Air Temp (°C)",
"ghi_w_m2": "GHI (W/m²)",
"wind_speed_ms": "Wind (m/s)",
"stage_id": "Stage",
}
display = {}
for key, label in cols_display.items():
val = tick.get(key)
if val is not None:
if isinstance(val, float):
display[label] = f"{val:.1f}"
else:
display[label] = str(val)
for label, val in display.items():
st.text(f"{label}: {val}")
# ======================================================================
# 4. Fruiting Zone Monitor
# ======================================================================
def _render_fruiting_zone():
st.subheader("Fruiting Zone Monitor")
st.caption(
"Mid-canopy conditions in the grape cluster zone "
f"(Zone {settings.FRUITING_ZONE_INDEX}, ~{settings.FRUITING_ZONE_HEIGHT_M}m height)."
)
# Get current vine sensor data
try:
from src.data.data_providers import DataHub
hub = DataHub.default()
snapshot = hub.vine_sensors.get_snapshot()
has_data = snapshot and "error" not in snapshot
except Exception:
snapshot = {}
has_data = False
if not has_data:
st.info("Live vine sensor data unavailable. Showing configuration thresholds.")
_render_fruiting_config()
return
# Extract fruiting-zone relevant metrics from the 2026 VineSnapshot.
# PAR/VPD sensors were retired in the 2026 refresh; we now read NDVI/PRI
# (canopy state) and the leaf-air delta-T (heat-stress proxy).
t_crop_treat = snapshot.get("treatment_crop_leaf_temp_c") or snapshot.get("treatment_leaf_temp_c")
t_crop_ref = snapshot.get("reference_crop_leaf_temp_c")
delta_t = snapshot.get("treatment_air_leaf_delta_t")
ndvi_treat = snapshot.get("treatment_crop_ndvi")
ndvi_ratio = snapshot.get("ndvi_ratio")
pri_treat = snapshot.get("treatment_crop_pri")
psri_treat = snapshot.get("treatment_crop_psri")
c1, c2, c3 = st.columns(3)
with c1:
if t_crop_treat is not None:
delta = None
if t_crop_ref is not None:
delta = f"{t_crop_treat - t_crop_ref:+.1f}°C vs ref"
st.metric("Canopy Temp (treatment)", f"{t_crop_treat:.1f}°C", delta)
else:
st.metric("Canopy Temp", "N/A")
with c2:
if ndvi_treat is not None:
ratio_str = f"{ndvi_ratio:.2f}× ref" if ndvi_ratio is not None else None
st.metric("NDVI (treatment)", f"{ndvi_treat:.3f}", ratio_str)
else:
st.metric("NDVI", "N/A")
with c3:
if delta_t is not None:
st.metric(
"Leaf−air ΔT",
f"{delta_t:+.1f}°C",
"heat stress" if delta_t > 2 else "ok",
)
else:
st.metric("Leaf−air ΔT", "N/A")
# Soil + photochemical indices row
soil_temp = snapshot.get("treatment_soil_temp_c")
soil_moisture = snapshot.get("treatment_soil_moisture_pct")
soil_moisture_deep = snapshot.get("treatment_soil_moisture_deep_pct")
panel_temp = snapshot.get("treatment_panel_temp_c")
panel_count = snapshot.get("panel_temp_active_count", 0) or 0
c4, c5, c6, c7 = st.columns(4)
if soil_temp is not None:
c4.metric("Soil Temp", f"{soil_temp:.1f}°C")
if soil_moisture is not None:
delta = f"deep {soil_moisture_deep:.1f}%" if soil_moisture_deep is not None else None
c5.metric("Soil Moisture (shallow)", f"{soil_moisture:.1f}%", delta)
if pri_treat is not None:
c6.metric("PRI", f"{pri_treat:.3f}", help="Photochemical Reflectance Index")
if panel_temp is not None:
c7.metric("Panel Temp", f"{panel_temp:.1f}°C", f"{panel_count}/12 active")
# Sunburn risk assessment (2026: no PAR sensor; rely on canopy temp + ΔT + PSRI)
st.markdown("---")
st.markdown("**Fruiting Zone Risk Assessment**")
risks = []
if t_crop_treat is not None and t_crop_treat >= settings.BERRY_SUNBURN_TEMP_C:
risks.append(
f"Berry temperature {t_crop_treat:.1f}°C exceeds sunburn "
f"threshold ({settings.BERRY_SUNBURN_TEMP_C}°C)"
)
if delta_t is not None and delta_t > 3:
risks.append(
f"Leaf−air ΔT {delta_t:+.1f}°C indicates active heat stress "
f"(leaf hotter than ambient)"
)
if psri_treat is not None and psri_treat > 0.2:
risks.append(
f"PSRI {psri_treat:.2f} elevated — early senescence / chlorosis signal"
)
if risks:
for r in risks:
st.error(r)
else:
st.success("No fruiting zone risks detected.")
_render_fruiting_config()
def _render_fruiting_config():
with st.expander("Fruiting Zone Thresholds"):
st.markdown(f"""
| Parameter | Value |
|-----------|-------|
| Zone index | {settings.FRUITING_ZONE_INDEX} (mid-canopy) |
| Zone height | {settings.FRUITING_ZONE_HEIGHT_M} m |
| Berry sunburn temp | {settings.BERRY_SUNBURN_TEMP_C}°C |
| Target PAR ceiling | {settings.FRUITING_ZONE_TARGET_PAR} µmol/m²/s |
| Semillon transition | {settings.SEMILLON_TRANSITION_TEMP_C}°C |
| Shade-eligible temp | {settings.SHADE_ELIGIBLE_TLEAF_ABOVE}°C |
""")
# ======================================================================
# 5. ROI Dashboard
# ======================================================================
def _render_roi_dashboard():
st.subheader("ROI Dashboard")
st.caption(
"Budget utilisation, intervention statistics, and Land Equivalent Ratio."
)
from src.roi_service import ROIService
roi = ROIService()
# Try loading the most recent simulation log
log_files = _load_sim_logs()
if log_files:
try:
with open(log_files[0]) as f:
tick_log = json.load(f)
roi.load_tick_log(tick_log)
st.caption(f"Using log: `{log_files[0].name}` ({len(tick_log)} ticks)")
except Exception as exc:
st.warning(f"Could not load log: {exc}")
tick_log = []
else:
tick_log = []
# Budget status
st.markdown("### Budget Utilisation")
budget = roi.get_budget_status()
c1, c2, c3 = st.columns(3)
c1.metric("Annual Budget", f"{budget.annual_budget_kwh:,.0f} kWh")
c2.metric("Spent", f"{budget.annual_spent_kwh:,.0f} kWh")
pct = budget.annual_utilisation_pct
c3.metric("Utilisation", f"{pct:.1f}%",
delta=f"{budget.annual_remaining_kwh:,.0f} kWh remaining",
delta_color="normal" if pct < 80 else "inverse")
# Budget gauge
try:
import plotly.graph_objects as go
fig = go.Figure(go.Indicator(
mode="gauge+number+delta",
value=pct,
delta={"reference": 100, "decreasing": {"color": "green"}},
gauge={
"axis": {"range": [0, 100]},
"bar": {"color": "#2196F3"},
"steps": [
{"range": [0, 50], "color": "#E8F5E9"},
{"range": [50, 80], "color": "#FFF3E0"},
{"range": [80, 100], "color": "#FFEBEE"},
],
"threshold": {
"line": {"color": "red", "width": 4},
"thickness": 0.75,
"value": 100,
},
},
title={"text": "Annual Budget Utilisation (%)"},
))
fig.update_layout(height=250, margin=dict(t=40, b=20))
st.plotly_chart(fig, key="budget_gauge")
except ImportError:
pass
if budget.is_over_budget():
st.error("Annual shading budget EXCEEDED!")
# Intervention stats
st.markdown("### Intervention Statistics")
stats = roi.compute_intervention_stats(label="all_time")
c1, c2, c3, c4 = st.columns(4)
c1.metric("Total Slots", stats.total_slots)
c2.metric("Interventions", stats.intervention_slots)
c3.metric("Rate", f"{stats.intervention_rate_pct:.1f}%")
c4.metric("Avg Offset", f"{stats.avg_offset_deg:.1f}°")
# LER calculator
st.markdown("### Land Equivalent Ratio (LER)")
st.caption(
f"Target LER: {settings.TARGET_LER:.1f} — "
"values above 1.0 mean combined land use is more productive than monoculture."
)
lc1, lc2 = st.columns(2)
with lc1:
actual_energy = st.number_input(
"Actual PV generation (kWh/year)",
value=int(roi.annual_gen * 0.97),
step=1000,
key="ler_energy",
)
with lc2:
crop_ratio = st.slider(
"Crop yield ratio (agri/mono)",
0.5, 1.5, 0.95, 0.05,
key="ler_crop",
)
ler = roi.compute_ler(
actual_energy_kwh=actual_energy,
actual_crop_yield=crop_ratio,
mono_crop_yield=1.0,
)
lm1, lm2, lm3 = st.columns(3)
lm1.metric("Energy Fraction", f"{ler.energy_fraction:.2f}")
lm2.metric("Crop Fraction", f"{ler.crop_fraction:.2f}")
color = "normal" if ler.meets_target else "inverse"
lm3.metric("LER", f"{ler.ler:.2f}",
delta="meets target" if ler.meets_target else "below target",
delta_color=color)