
Spaces:
Running

Cloud2Grid: From Clouds to Grid to Value

Cloud2Grid: From Clouds to Grid to Value
- 👤 Team: Oriol Hinojo
- ✉️ Contact: ohinojo98@gmail.com · open an issue · GitHub @hinox13 · Hugging Face @oriolh
- 🌐 Website · 💻 Code · 📦 Models · 🔁 Reproduction
A grid foundation model met a real electricity network, and predicted power flowing the wrong way.
On a UK distribution network rebuilt from open data, pretrained GENCO had the network exporting power where the AC reference has it importing, in 99.9 % of the reconstructed 2024 operating states. Synthetic-only adaptation recovered, for the best training seed, how the grid responds to solar, and exposed a deeper challenge: a model can learn the right physical response while still predicting the wrong absolute electrical state.
▶ Open the interactive application: one real day, 15 June 2024, from Meteosat clouds → satellite-estimated solar power → the reconstructed grid's response → adapted GENCO → an illustrative value. Two minutes in the browser, nothing to install.
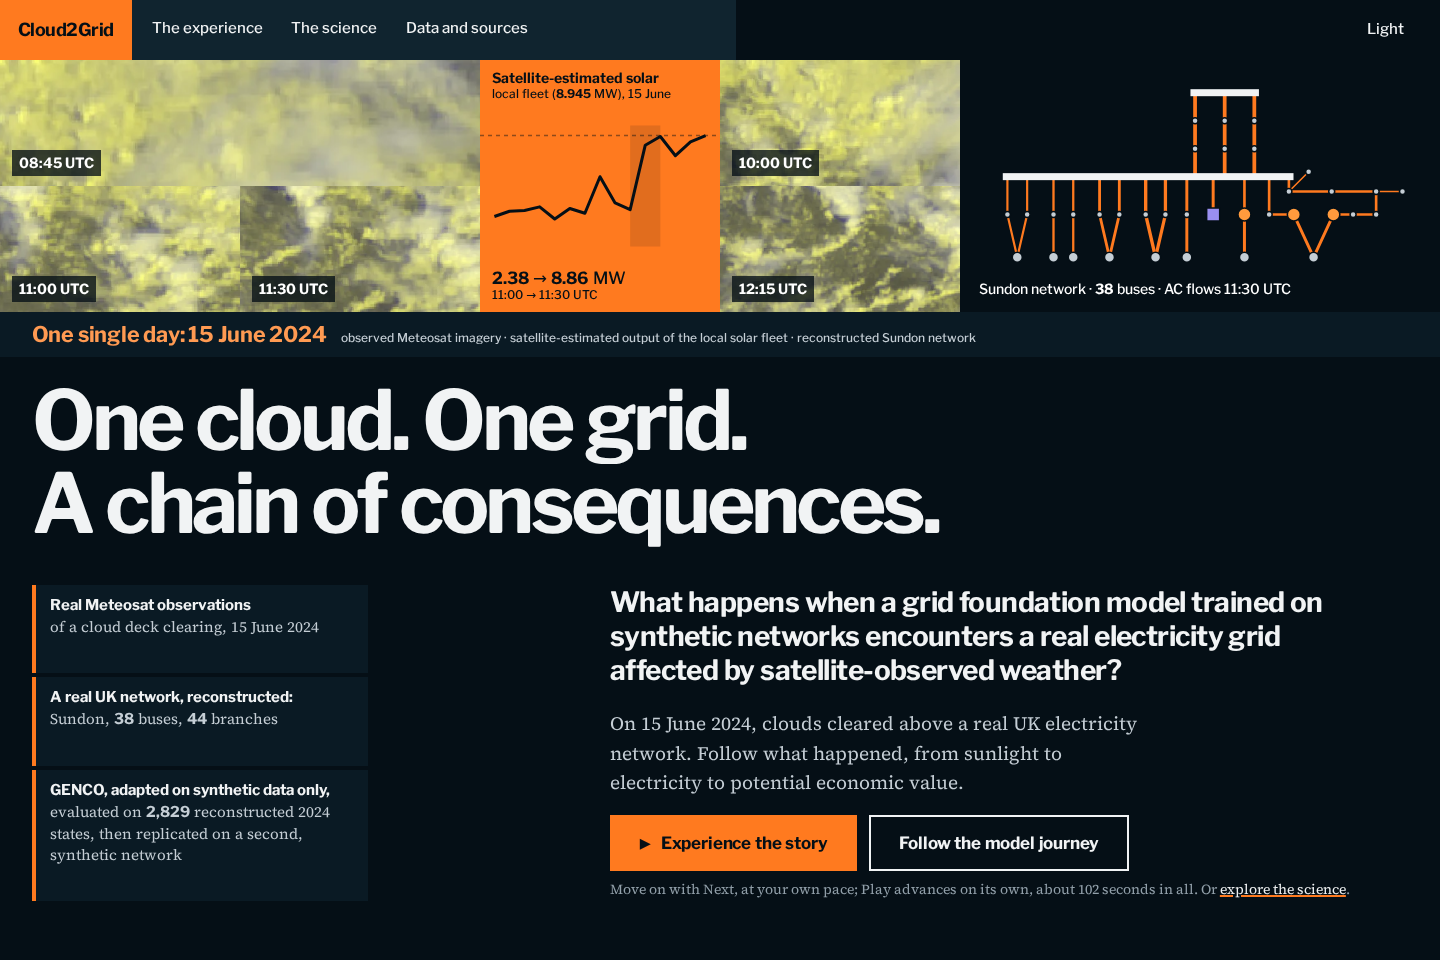
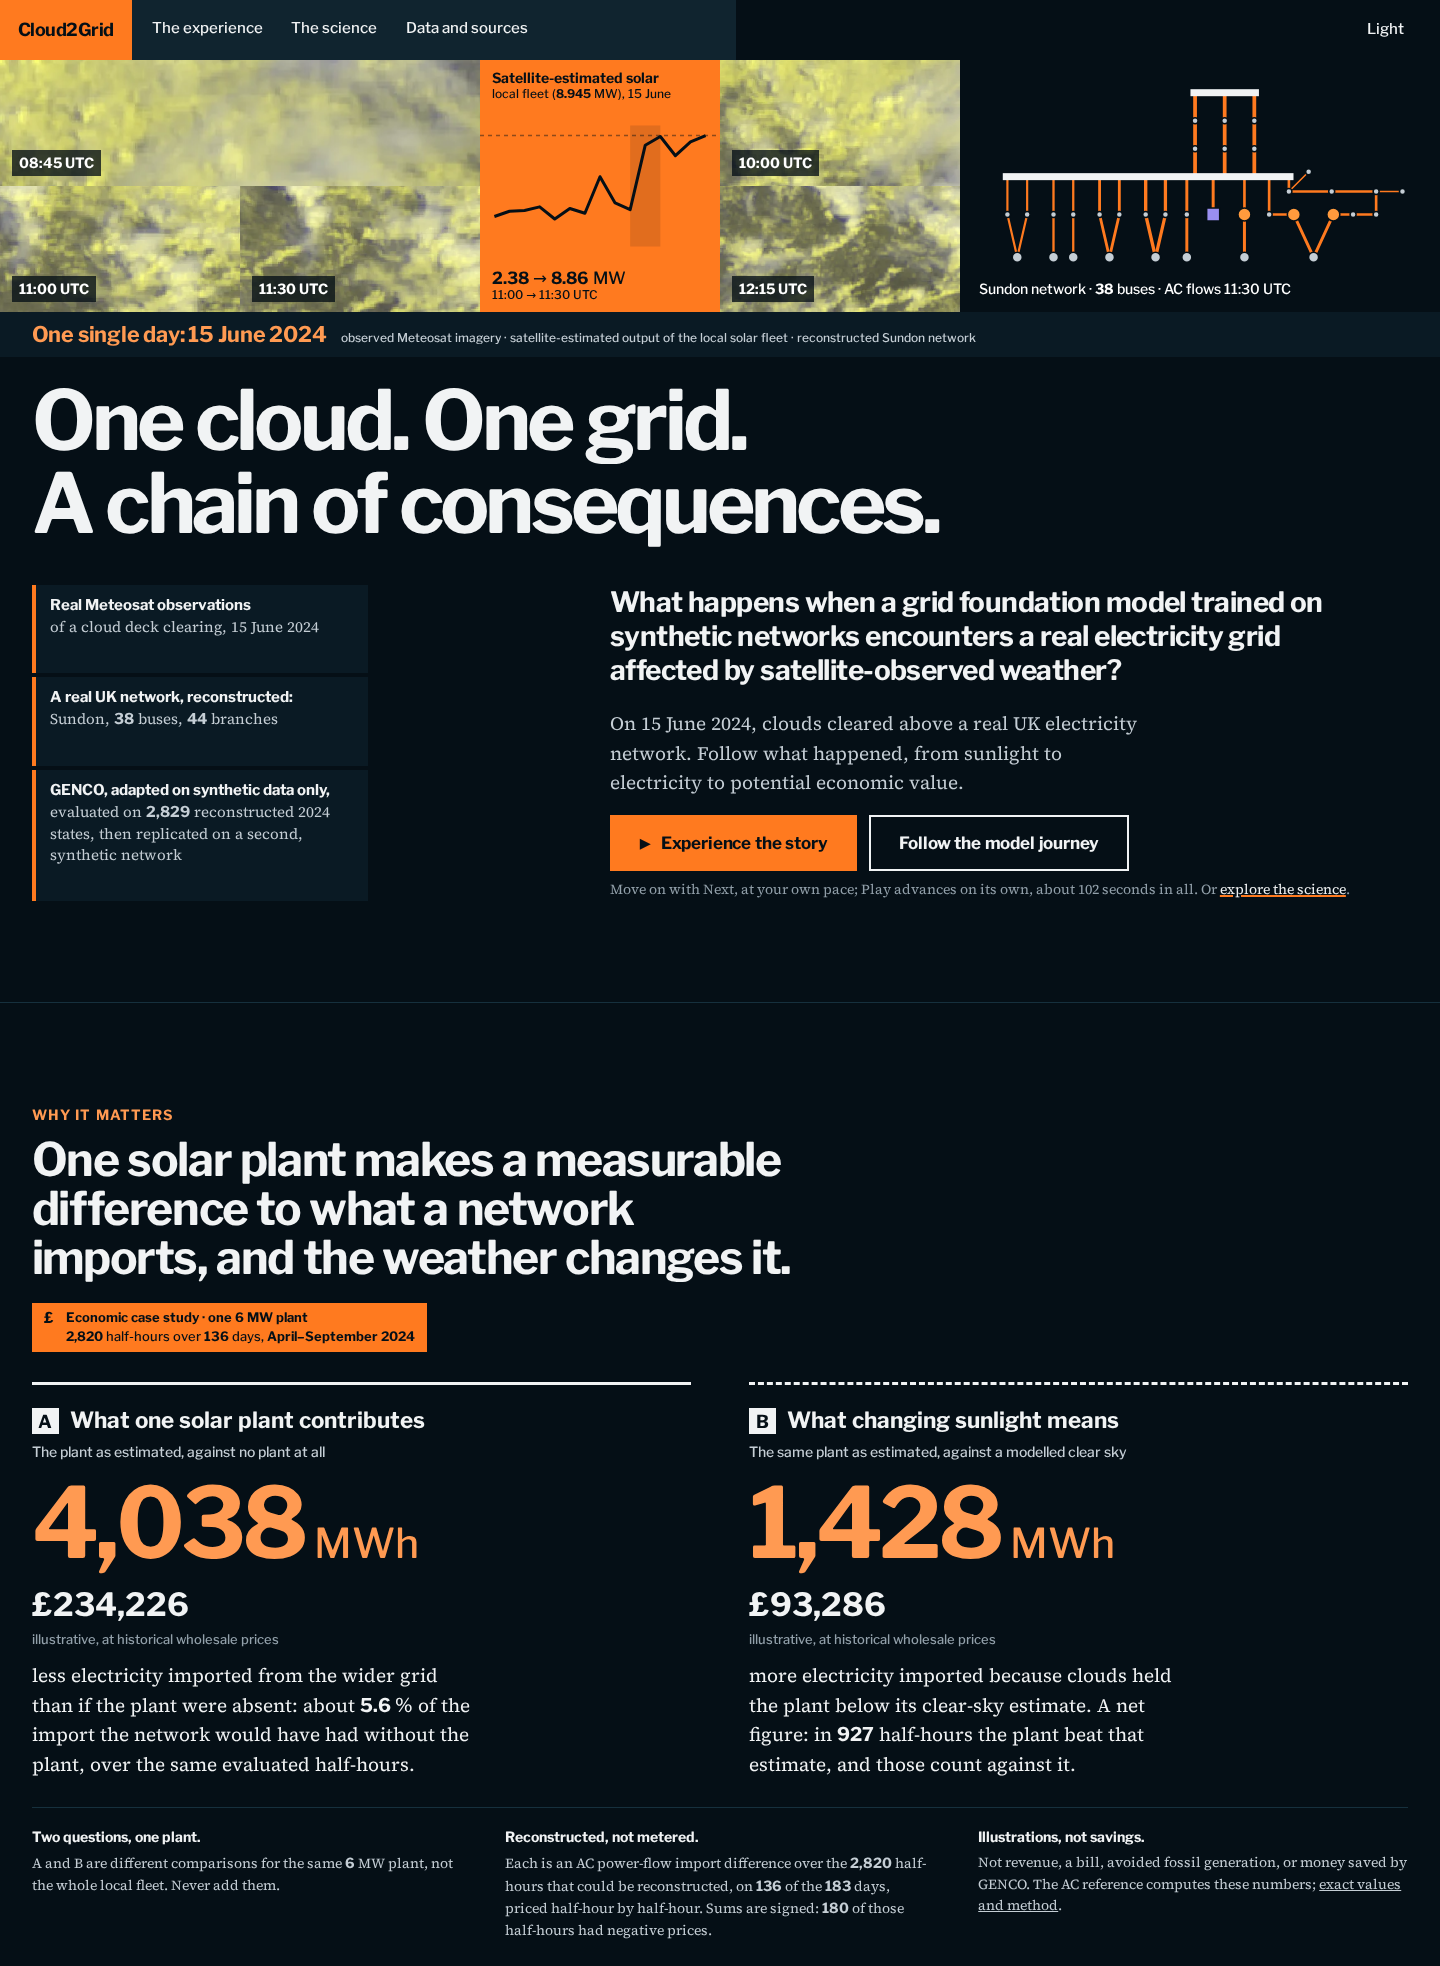
The Cloud2Grid website (click to open): observed Meteosat imagery, satellite-estimated solar output and the reconstructed Sundon network on 15 June 2024.
🌐 Cloud2Grid website: guided experience and Scientific Explorer · 💻 Code · 📦 Frozen models + verification data · 🔁 Reproduce in one command
In 30 seconds
- The problem. Applied zero-shot to Sundon's reconstructed network, the official
genco-pf-transfercheckpoint showed a major transfer gap for this unseen topology: besides reversing the import/export direction, it missed the grid import by about 260 MW on average (§5). - The contribution. With the open GridFM toolkits and synthetic training data only, broader coverage of the operating envelope cut the real-state power-balance error by 99 %. A physics-response-aware loss, which we implemented in GraphKit and trained on pairs of synthetic AC states, then taught GENCO the grid's sensitivity to solar: −1.07 MW per MW of PV, against −1.02 in AC, for the best of three training seeds; the result is seed-dependent (§6–7).
- The discovery. Accurate absolute states and accurate physical responses were not achieved together. The response-aware model's import remains 13.1 MW too high (pre-registered verdict: partial transfer), while the envelope-tuned model, more accurate on most absolute-state metrics, barely responds to solar. A post-hoc diagnostic identifies a mechanism consistent with this: the import error is almost identical in both states of a pair, so it cancels in the change that the response loss supervises (§8–9).
Why it matters. For one 6 MW plant over the evaluated April–September 2024 half-hours, the reconstructed grid import it displaced is worth an illustrative £234,226 at historical wholesale prices, and the extra import caused by clouds £93,286 net: two separate comparisons, never to be added, and illustrations rather than realised savings (§11). Once validated, a response-aware grid model could link Earth-observation and weather products, such as Destination Earth's Extremes Digital Twin or AI4Clouds, with renewable-generation forecasts and market data, turning expected weather into power flows, constraints, storage and flexibility needs, and those into value. Cloud2Grid implements only the grid-response link; the others are independent examples, not part of this study.
Only the cloud imagery is observed: the network is rebuilt from UK Power Networks open data, solar output is satellite-derived, the operating states are AC reconstructions and the AC reference is simulated. A second network reproduced the response result in two of three seeds, on synthetic states only: its historical-operation reconstruction failed validation (§10).
1. The question: adapting a grid foundation model to a real distribution network
Grid foundation models such as GENCO are pretrained and benchmarked on synthetic networks and operating states, and the open GridFM ecosystem provides the tooling to fine-tune them (gridfm-graphkit) and to generate new AC-solved training data (gridfm-datakit). Real distribution grids add three demanding conditions at once: an idiosyncratic topology, states shaped by real demand and storage, and renewable output that follows the weather. We asked what it takes to adapt the pretrained checkpoint to such a grid with synthetic training data only, and how to tell whether the adapted model has learned the right physical responses as well as accurate states.
2. The approach: Earth observation, open grid data and the GridFM toolkits
Cloud2Grid connects three open sources end to end, and keeps every layer's provenance explicit:
| Layer | Source | Class |
|---|---|---|
| Cloud imagery | EUMETSAT Meteosat E-View, every 15 minutes | Observed |
| Solar power | EUMETSAT LSA SAF surface radiation at every registered PV plant, converted with pvlib | Derived |
| Grid states | AC power flow on the network rebuilt from UK Power Networks open data | Simulated |
| GENCO output | the official gridfm/genco-pf-transfer checkpoint, then our fine-tuned versions |
Predicted |
GENCO is only ever trained on synthetic states generated with gridfm-datakit on the rebuilt network, with the official gridfm-graphkit fine-tuning loop. Real 2024 states are used for evaluation only, after each model is frozen.
2024 operating states ("real states" for short) are observation-informed AC reconstructions: AC power-flow solutions driven by UK Power Networks' metered half-hourly demand and storage data and by the satellite-derived PV estimate. They are not measurements of the full electrical state.
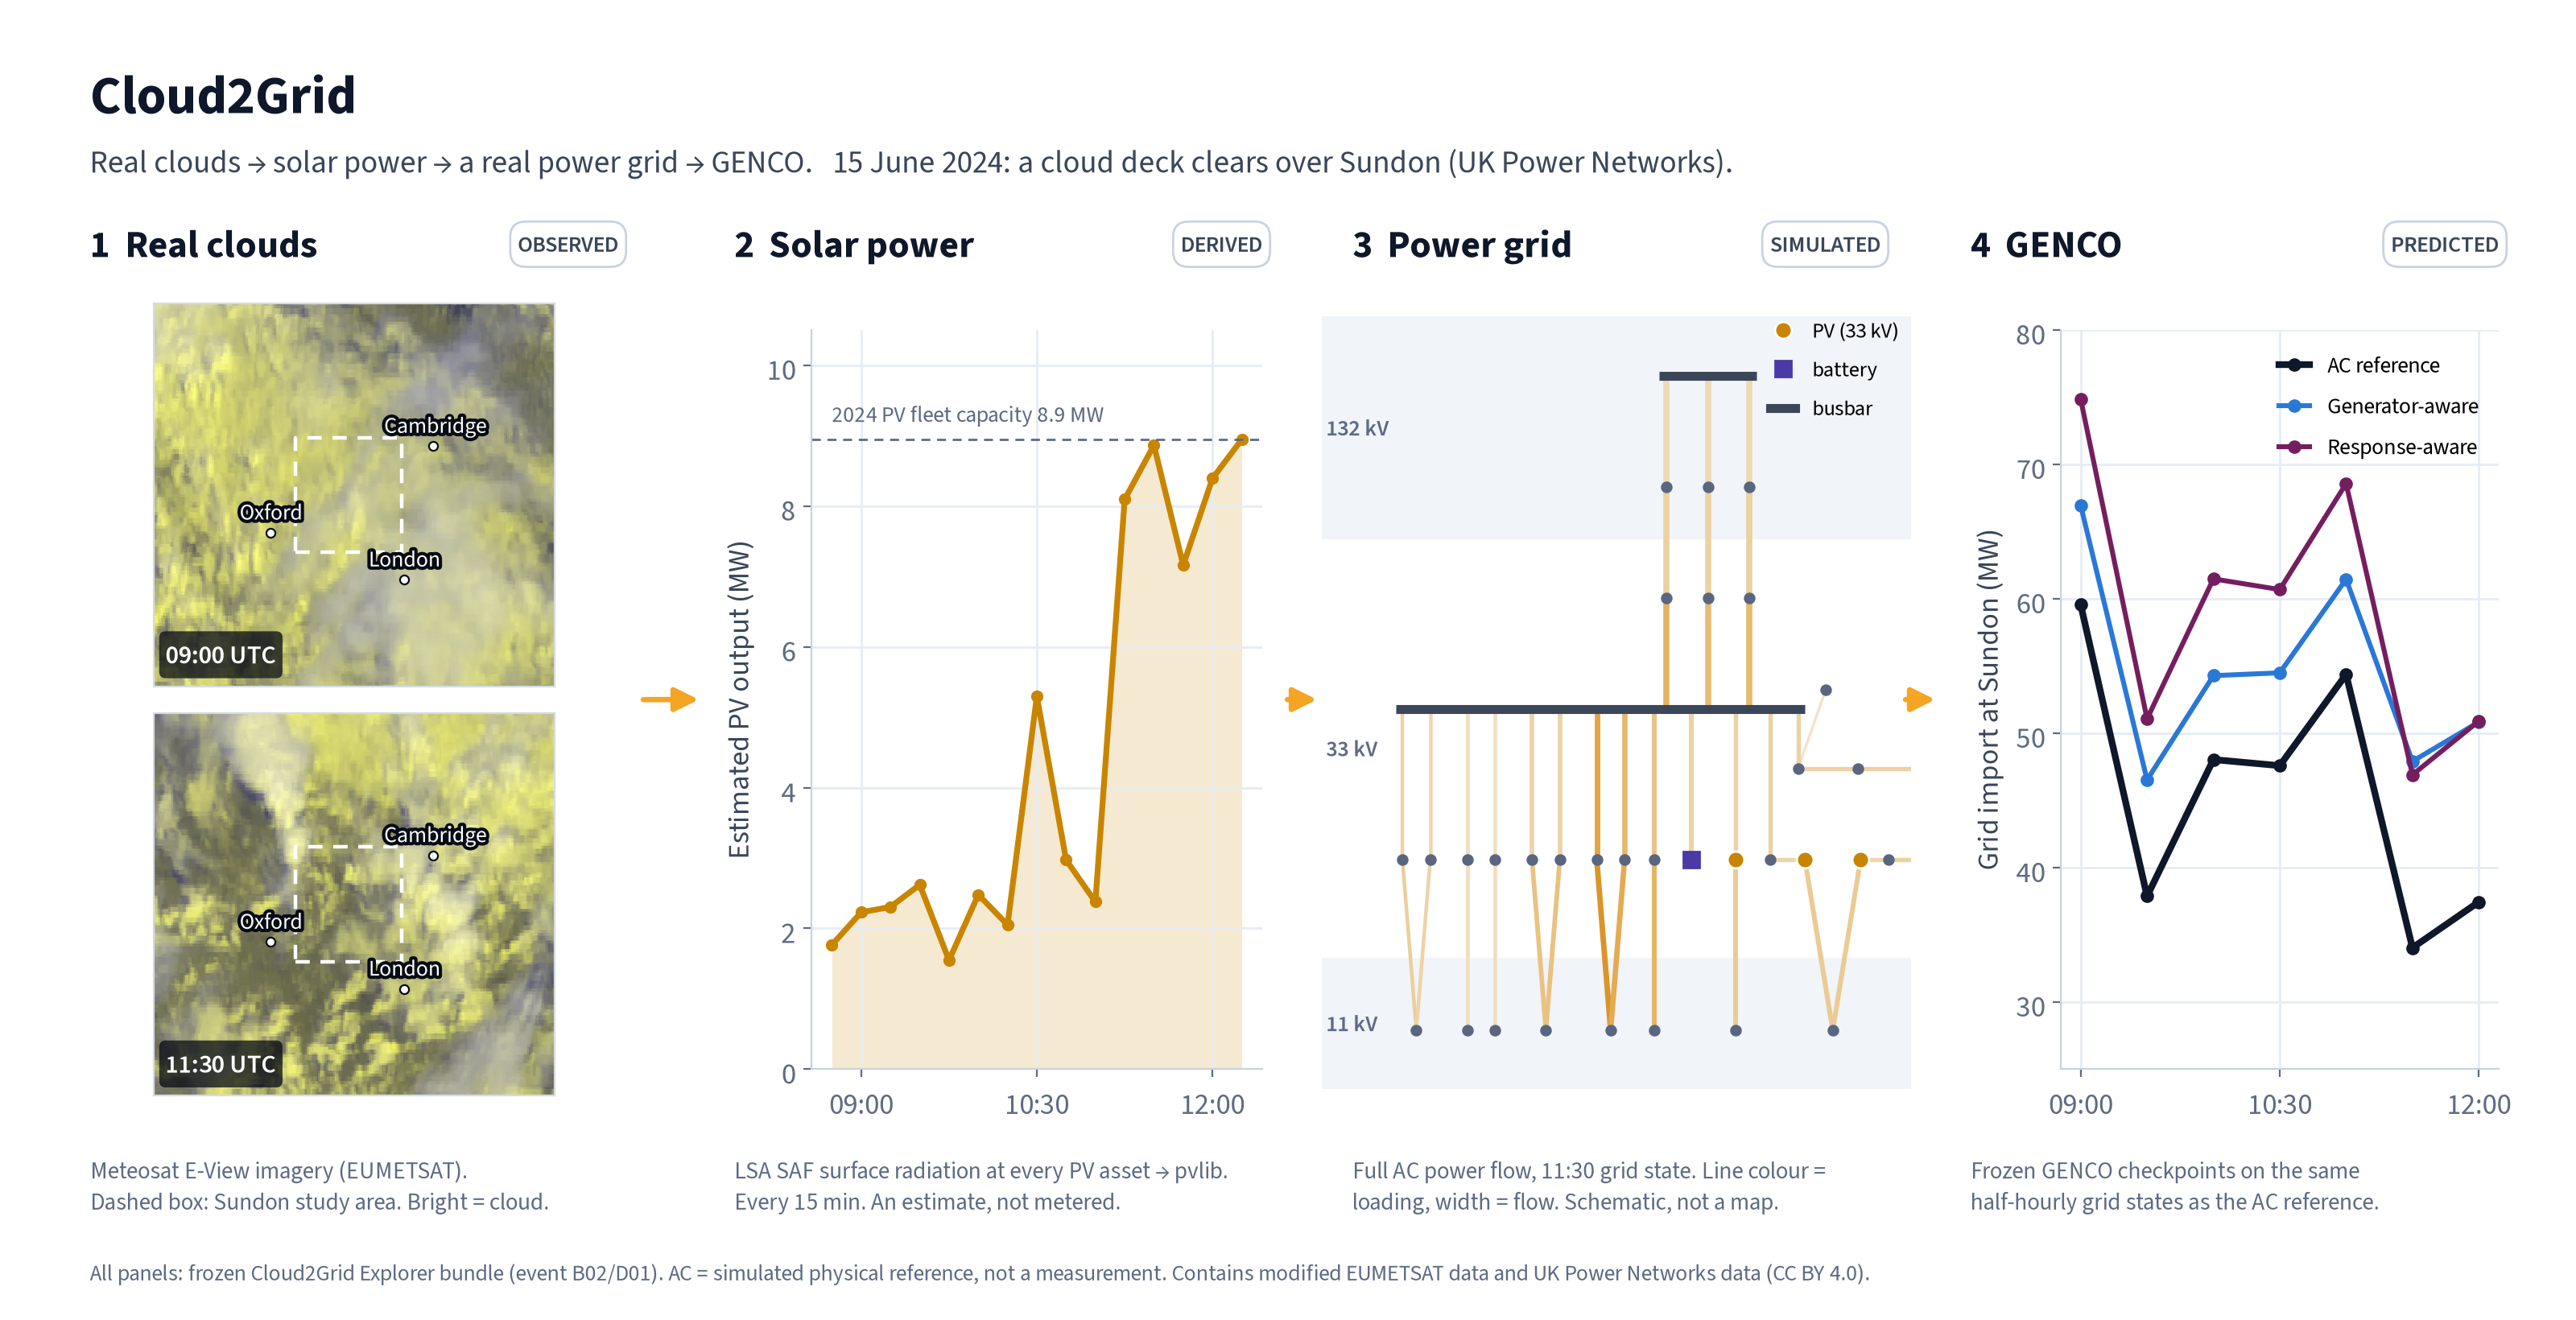
Real clouds → solar power → a real power grid → GENCO. Each panel is labelled with its provenance: observed imagery, derived PV, simulated AC power flow, predicted GENCO output.
3. A real network, rebuilt from open data and validated against meters
- Sundon, a 132/33/11 kV UK Power Networks area in Bedfordshire, rebuilt from published network data: 38 nodes, 44 branches, every parameter traced to a published UKPN identifier.
- Two independent AC solvers agree: pandapower and gridfm-datakit's PowerModels.
- Validated against metered circuits never used as inputs (200 timestamps over 18 months): 100 % AC convergence, total grid-import NMAE 0.084, power-flow direction correct 99–100 % of the time. Pre-registered verdict: usable with limitations.
→ Validation details: reports/e2_operational_validation.md
4. From satellite to solar power
- Historical capacity, not today's: only 8.945 MW of Sundon's PV was connected in 2024 (against 43.9 MW today), verified from connection dates in the Embedded Capacity Register and published network statements.
- Every 15 minutes, April–September 2024: LSA SAF surface radiation is sampled at each plant and converted to output with a fixed, documented pvlib chain (Hay–Davies transposition, Faiman cell temperature, PVWatts). 9,040 slots, of which 8,308 are usable.
- An estimate, never a measurement. The PV model was configured before any radiation data were available, and it is never fitted to grid data.
5. Zero-shot baseline: the unseen topology comes first
We first applied the official gridfm/genco-pf-transfer checkpoint (pretrained on 100 subgrids) without adaptation, as the GENCO paper does on an unseen grid; our environment reproduces that paper's IEEE 118 zero-shot evaluation to within 0.03 % on every metric. Sundon is a demanding target: a radial-meshed distribution network with very short, near-zero-impedance 33 kV connections, tee junctions and a single slack supply. On conventional synthetic Sundon states, with no weather at all, the checkpoint leaves an active-power residual of 33.7 MW, against 0.225 MW for a simple DC power flow (149×). DC power flow is a linearised solve of the exact network model, used here as a reference scale, not as a like-for-like competitor to a learned model applied zero-shot. These results characterise this specific checkpoint under our evaluation conditions, not GENCO's capabilities in general. Since the topology gap appears before weather enters, adapting to the network came first.
The gap is just as clear on the 2,829 observation-informed, AC-reconstructed 2024 operating states. Under our evaluation conditions, the checkpoint predicts that Sundon exports about 211 MW, where the AC reference imports about 49 MW: an import bias of −260 MW, with the import/export direction reversed in 99.9 % of states.
6. Progressive adaptation: from topology transfer to physical-response learning
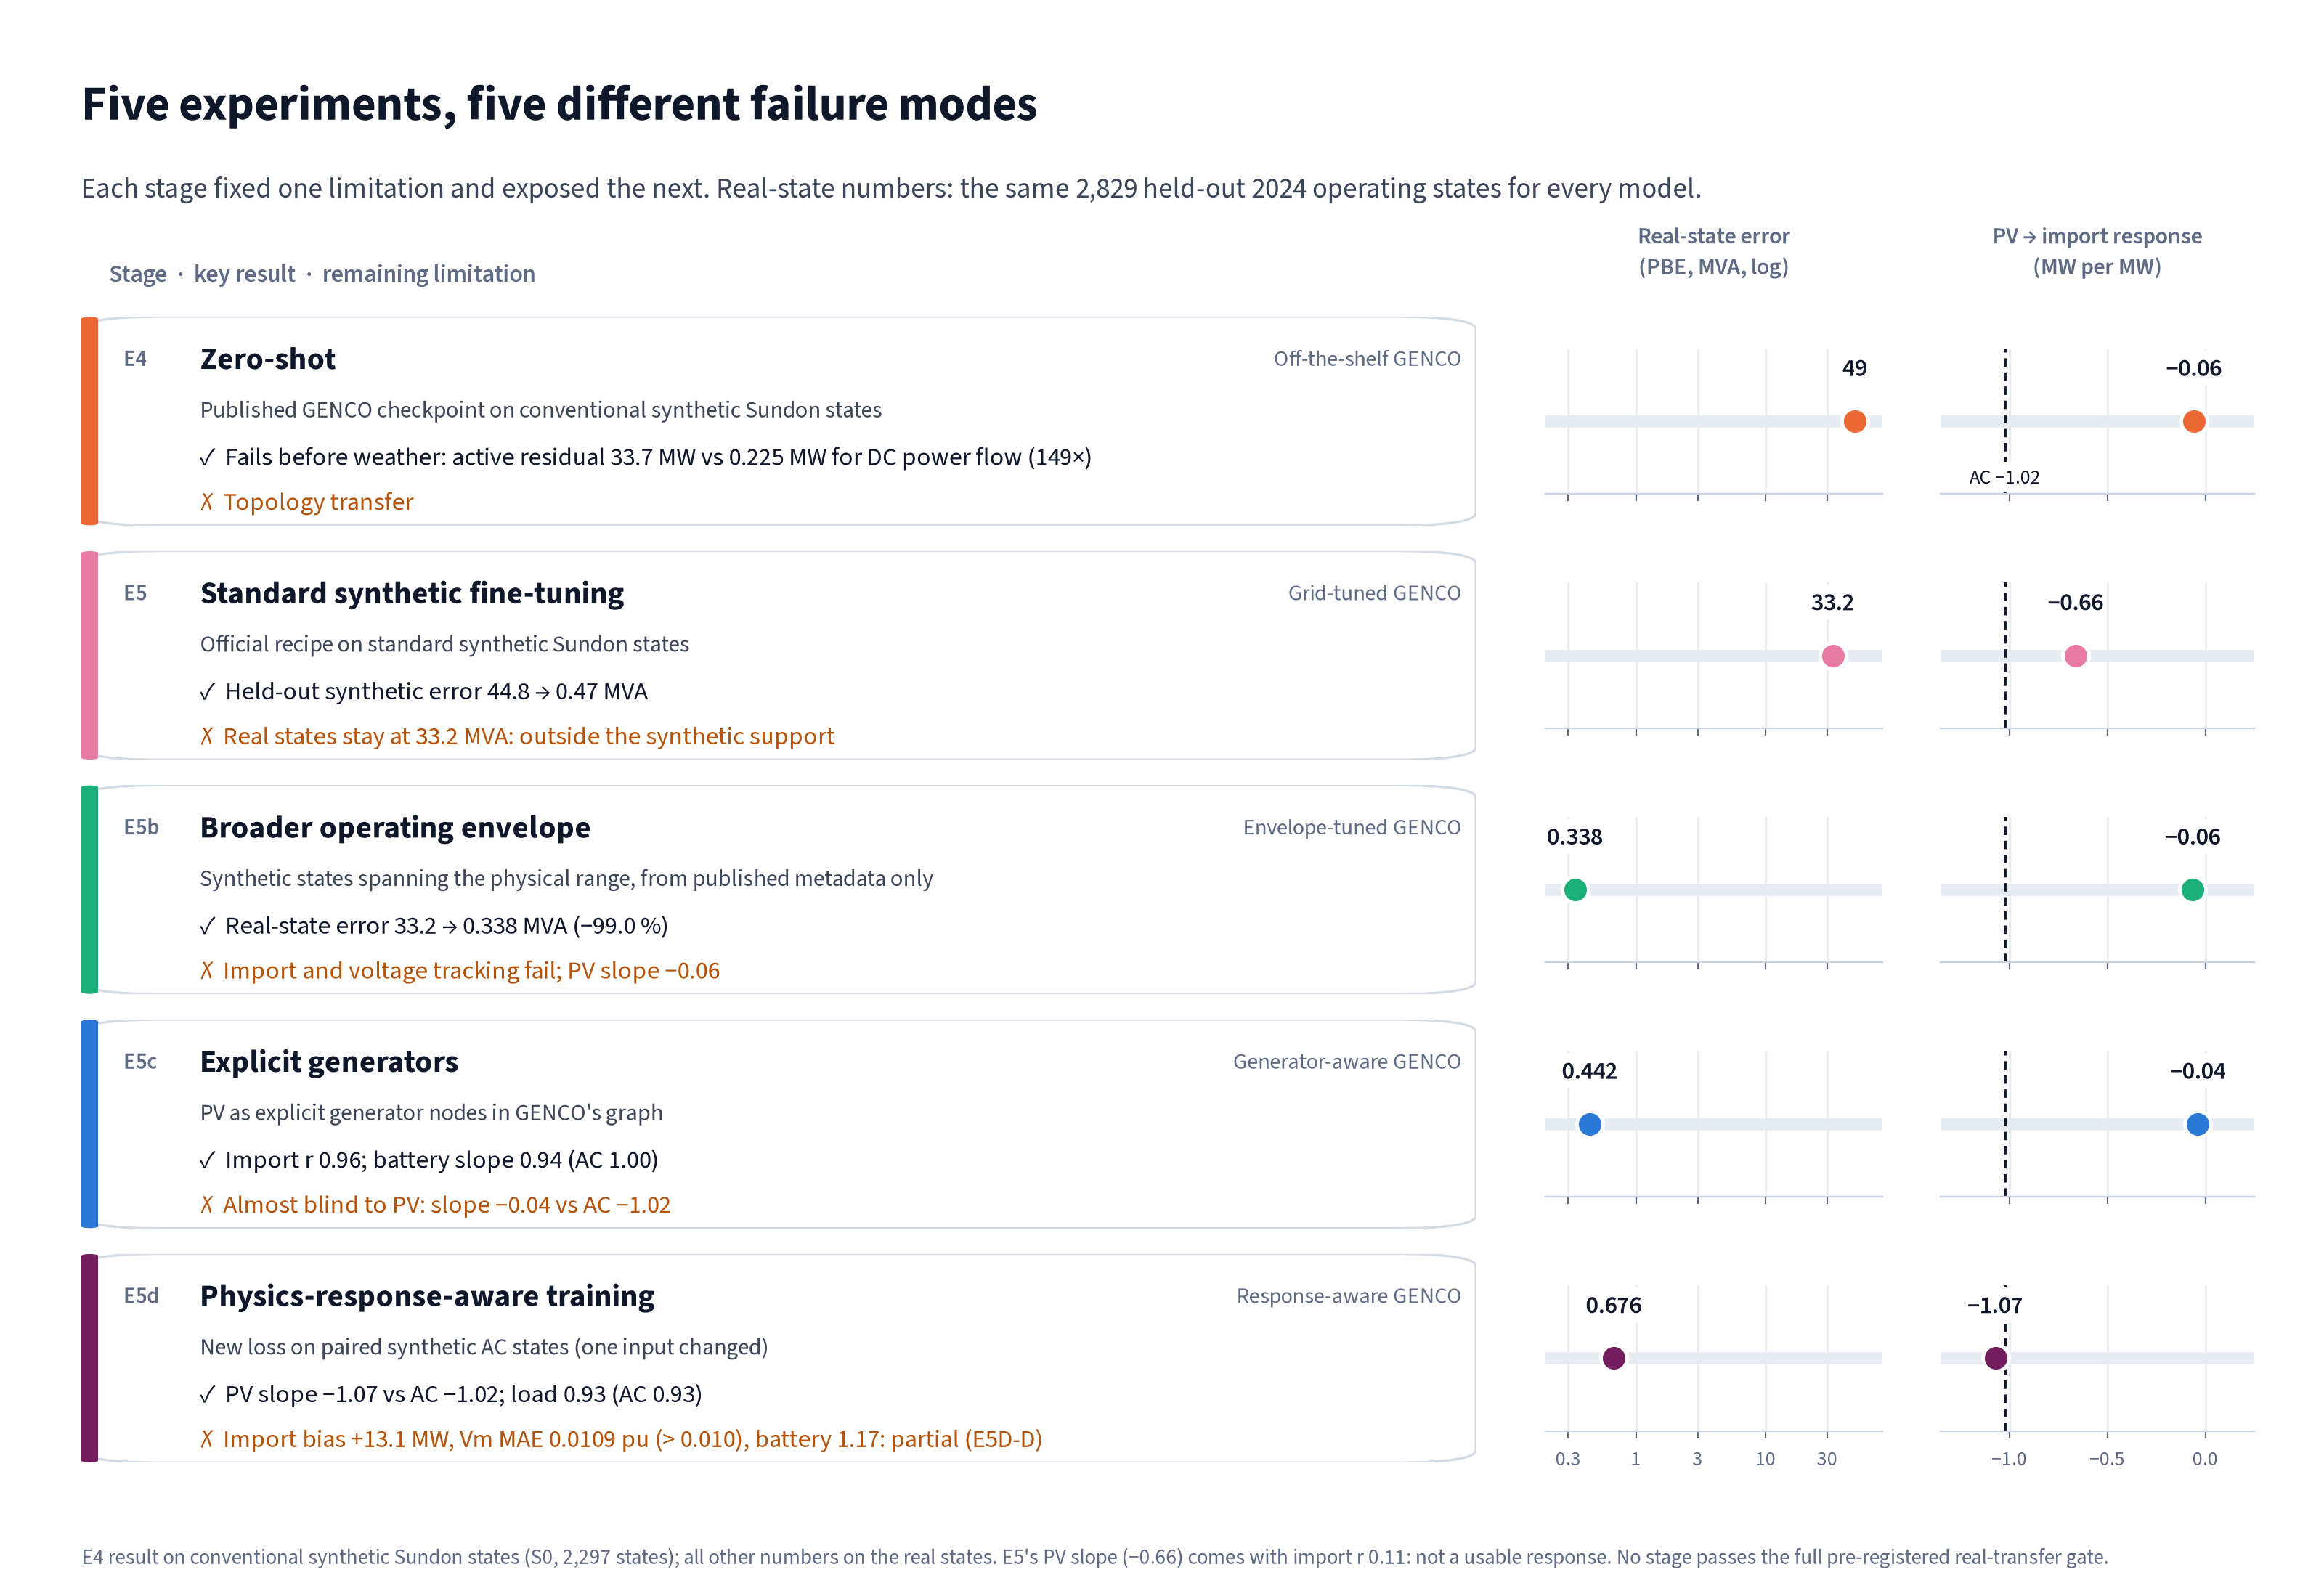
Every adaptation experiment was pre-registered, with frozen evaluation rules and documented outcomes: gates, selection rules and verdict rules were committed before its data or training existed. The E5 coded verdict required a published erratum; the original experimental files remain unchanged. Checkpoints were selected on synthetic data only, then frozen and SHA256-hashed before any real state was opened; failed gates are kept, not relaxed. Each step addressed one limitation and revealed the next requirement:
- Zero-shot (E4): a substantial transfer gap for the unseen topology (above).
- Standard synthetic fine-tuning (E5): held-out synthetic error falls from 44.8 to 0.47 MVA, but real states stay at 33.2 MVA. This gap between held-out synthetic and 2024 accuracy is consistent with a mismatch between the initial synthetic training distribution and the target operating conditions.
- A broader operating envelope (E5b): −99.0 % real-state error. Synthetic states spanning the physically plausible range, built from published metadata only, bring the real-state error to 0.338 MVA.
- Generator-aware adaptation (E5c): import correlation reaches 0.96 and the battery response 0.94 (AC 1.00), but the import responds only weakly to PV.
- Physics-response-aware training (E5d): the PV sensitivity is learned and, for the selected seed, transfers to real states; the absolute import level remains biased.
| Stage | PBE (MVA) ↓ | Active res. (MW) ↓ | Import MAE (MW) ↓ | Import r ↑ | PV slope (AC −1.02) |
|---|---|---|---|---|---|
| E4 Pretrained, zero-shot | 49.0 | 28.9 | 260 | 0.05 | −0.06 |
| E5 Grid-tuned | 33.2 | 28.8 | 70.7 | 0.11 | −0.66¹ |
| E5b Envelope-tuned | 0.338 | 0.270 | 7.30 | 0.87 | −0.06 |
| E5c Generator-aware | 0.442 | 0.342 | 7.74 | 0.96 | −0.04 |
| E5d Response-aware | 0.676 | 0.567 | 13.2 | 0.994 | −1.07 |
2024 operating states, same 2,829 for every model. PBE = mean nodal power-balance error. DC power-flow active residual: 0.098 MW. ¹ E5's slope comes with an import 17.7× too dispersed (r 0.11), so it cannot be read as a physical response.
7. Response-aware adaptation: learning how the grid responds to solar
What we measured. The generator-aware model (E5c) tracked the variation of the grid import closely (r 0.96), but on held-out synthetic pairs its import response to PV was 1.4 % of the AC one.
A plausible mechanism, not isolated by intervention. A PV change of a few MW moves the import by about the same few MW. In a state importing about 50 MW, that is a small share of the per-state error the ordinary objective penalises, so a model can fit absolute states well while giving the change little weight.
Our extension: supervise the response as well as the state. Sensitivity supervision has precedents in scientific machine learning; our contribution is a concrete implementation for GENCO, evaluated on a real network:
- Paired synthetic AC states. Each pair is identical except for one input: the PV output, the battery or one load. Both states are solved with full AC power flow.
- Supervise the change. The loss penalises the gap between GENCO's predicted change, ŷ(B) − ŷ(A), and the AC change, for grid import, branch flows, voltage magnitudes and angles. It is normalised per MW of perturbation, so a 0.05 MW PV step counts as much as a 5 MW one.
- Keep the original objective. The total loss is L_original + λ·κ·L_response. It runs as a plugin task inside the official gridfm-graphkit fine-tuning loop and adds no parameters.
Only synthetic states and static network metadata were used for training, normalisation and checkpoint selection. No real state, satellite value or real slope was used.
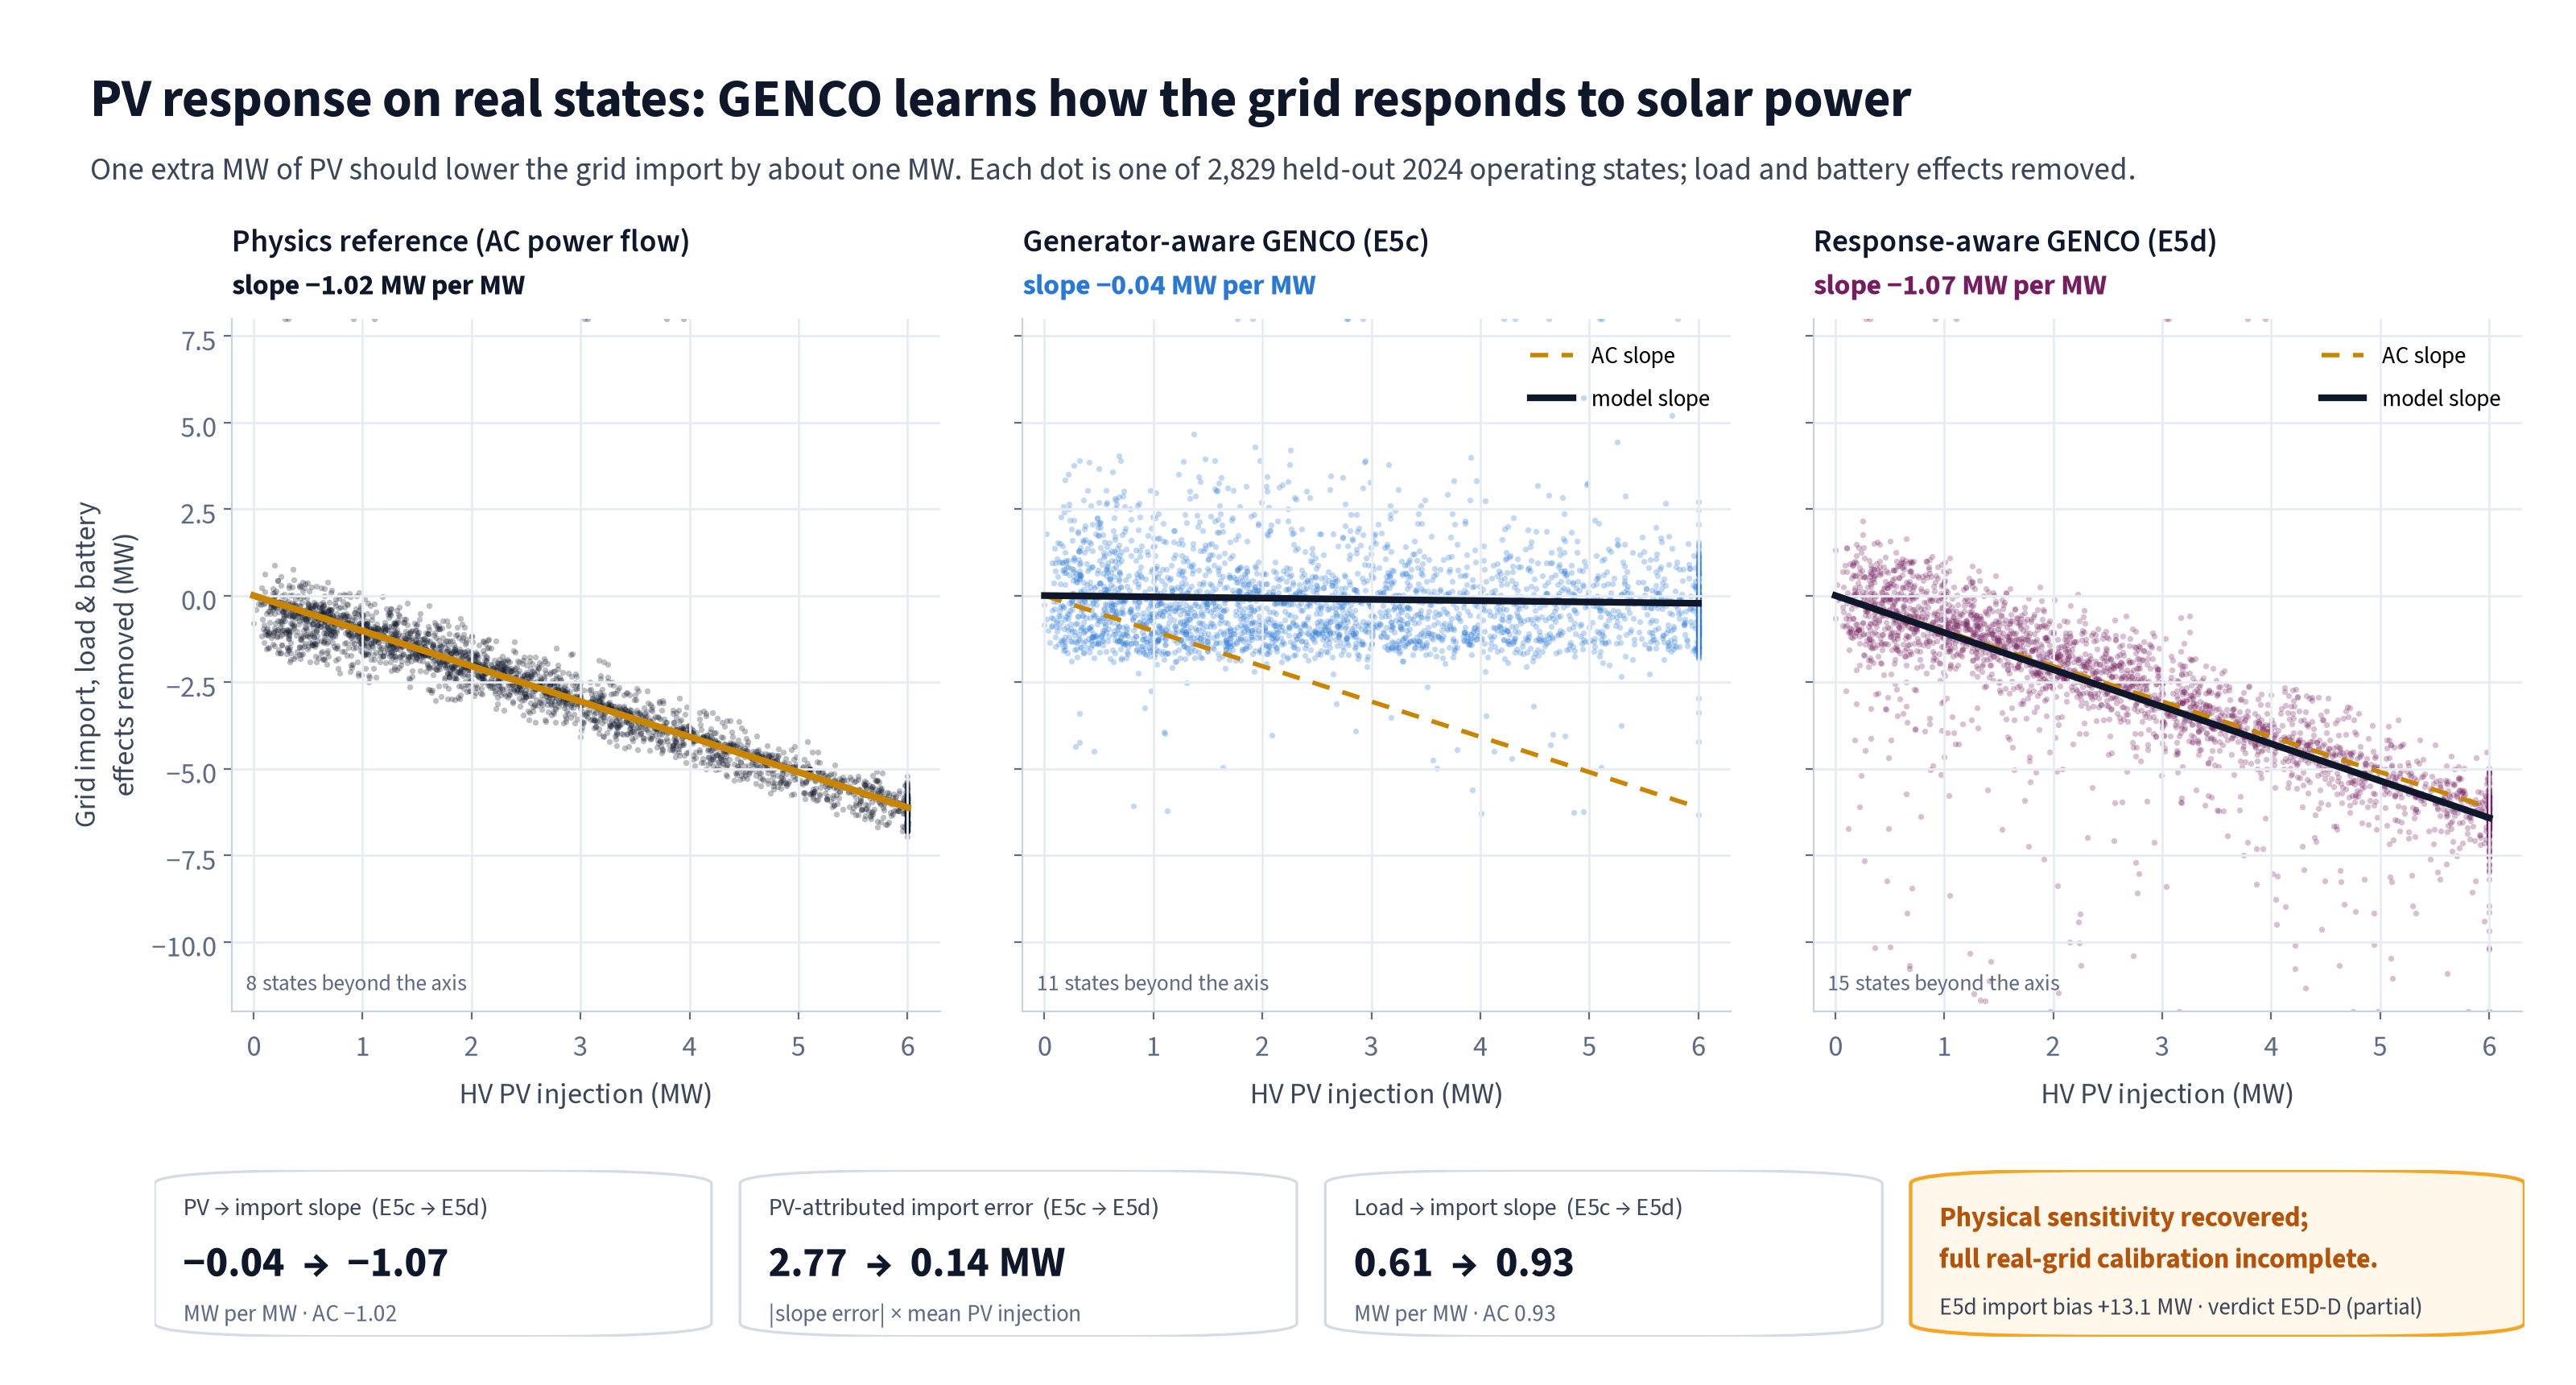
- Held-out synthetic pairs: the PV import-response ratio rises from 0.014 (E5c) to ≈ 1.0 (E5d) (0.997 published; 0.999 in our fresh-clone CPU re-run). Battery, load and the distributed branch-flow and voltage responses are also recovered. An identical run without the response loss remains insensitive to PV (0.001).
- 2024 operating states the model never saw: the PV-to-import slope moves from −0.04 (E5c) to −1.07 (E5d; AC −1.02); the PV-attributed import error falls from 2.77 to 0.14 MW; the load response is 0.93, matching AC's 0.93.
- Across the network, not only at the substation (2024 states): the median branch-flow PV-response error falls from 0.074 to 0.014 MW per MW, and the median bus voltage-angle PV-response error from 0.050 to 0.0009 ° per MW (the AC angle response itself is 0.053 ° per MW; the bus-angle figures are a post-verdict, report-only diagnostic). Each error is the median, over branches or buses, of the absolute difference between the model's and the AC reference's fitted PV slope. This shows a distributed sensitivity was learned; it does not show accurate absolute states.
- Seed dependence: on the 2024 states, the two other λ = 1 training seeds reached 0.68 and 0.80 of the AC reference response, with import biases of +65.4 and +19.2 MW. Only the selected seed recovered the response; the result is not seed-stable.
How to read this comparison. The matched control (identical code, data and seed, without the response loss) isolates the benefit of response supervision within our evaluated implementation, on held-out synthetic PV pairs. On the 2024 operating states that control was unstable (its fitted PV slope even has the wrong sign), so it is not an interpretable real-state ablation; E5c is a separately trained checkpoint, not the ablation. E5c, E5d and the control share a limitation in our generator representation: because we placed the Leighton Buzzard PV and wind generators on PQ buses, their generation was omitted from the model's internal physics feedback. Evaluation uses the correct generation values, so the reported results remain valid. This limits conclusions about ordinary GENCO fine-tuning beyond our implementation.
8. Transfer to the 2024 operating states: what improved and what remains open
| Pretrained checkpoint (zero-shot) | Best on most absolute-state metrics (E5b) | Response-aware (E5d) | AC reference | |
|---|---|---|---|---|
| Real-state power-balance error (MVA) ↓ | 49.0 | 0.338 | 0.676 | 0 |
| Grid-import response to PV (MW per MW) | −0.06 | −0.06 | −1.07 | −1.02 |
| Grid-import bias (MW) | −260 | +4.4 | +13.1 | 0 |
Same 2,829 AC-reconstructed half-hourly 2024 operating states for every model. AC values are simulated physical references for the reconstructed network, not measurements.
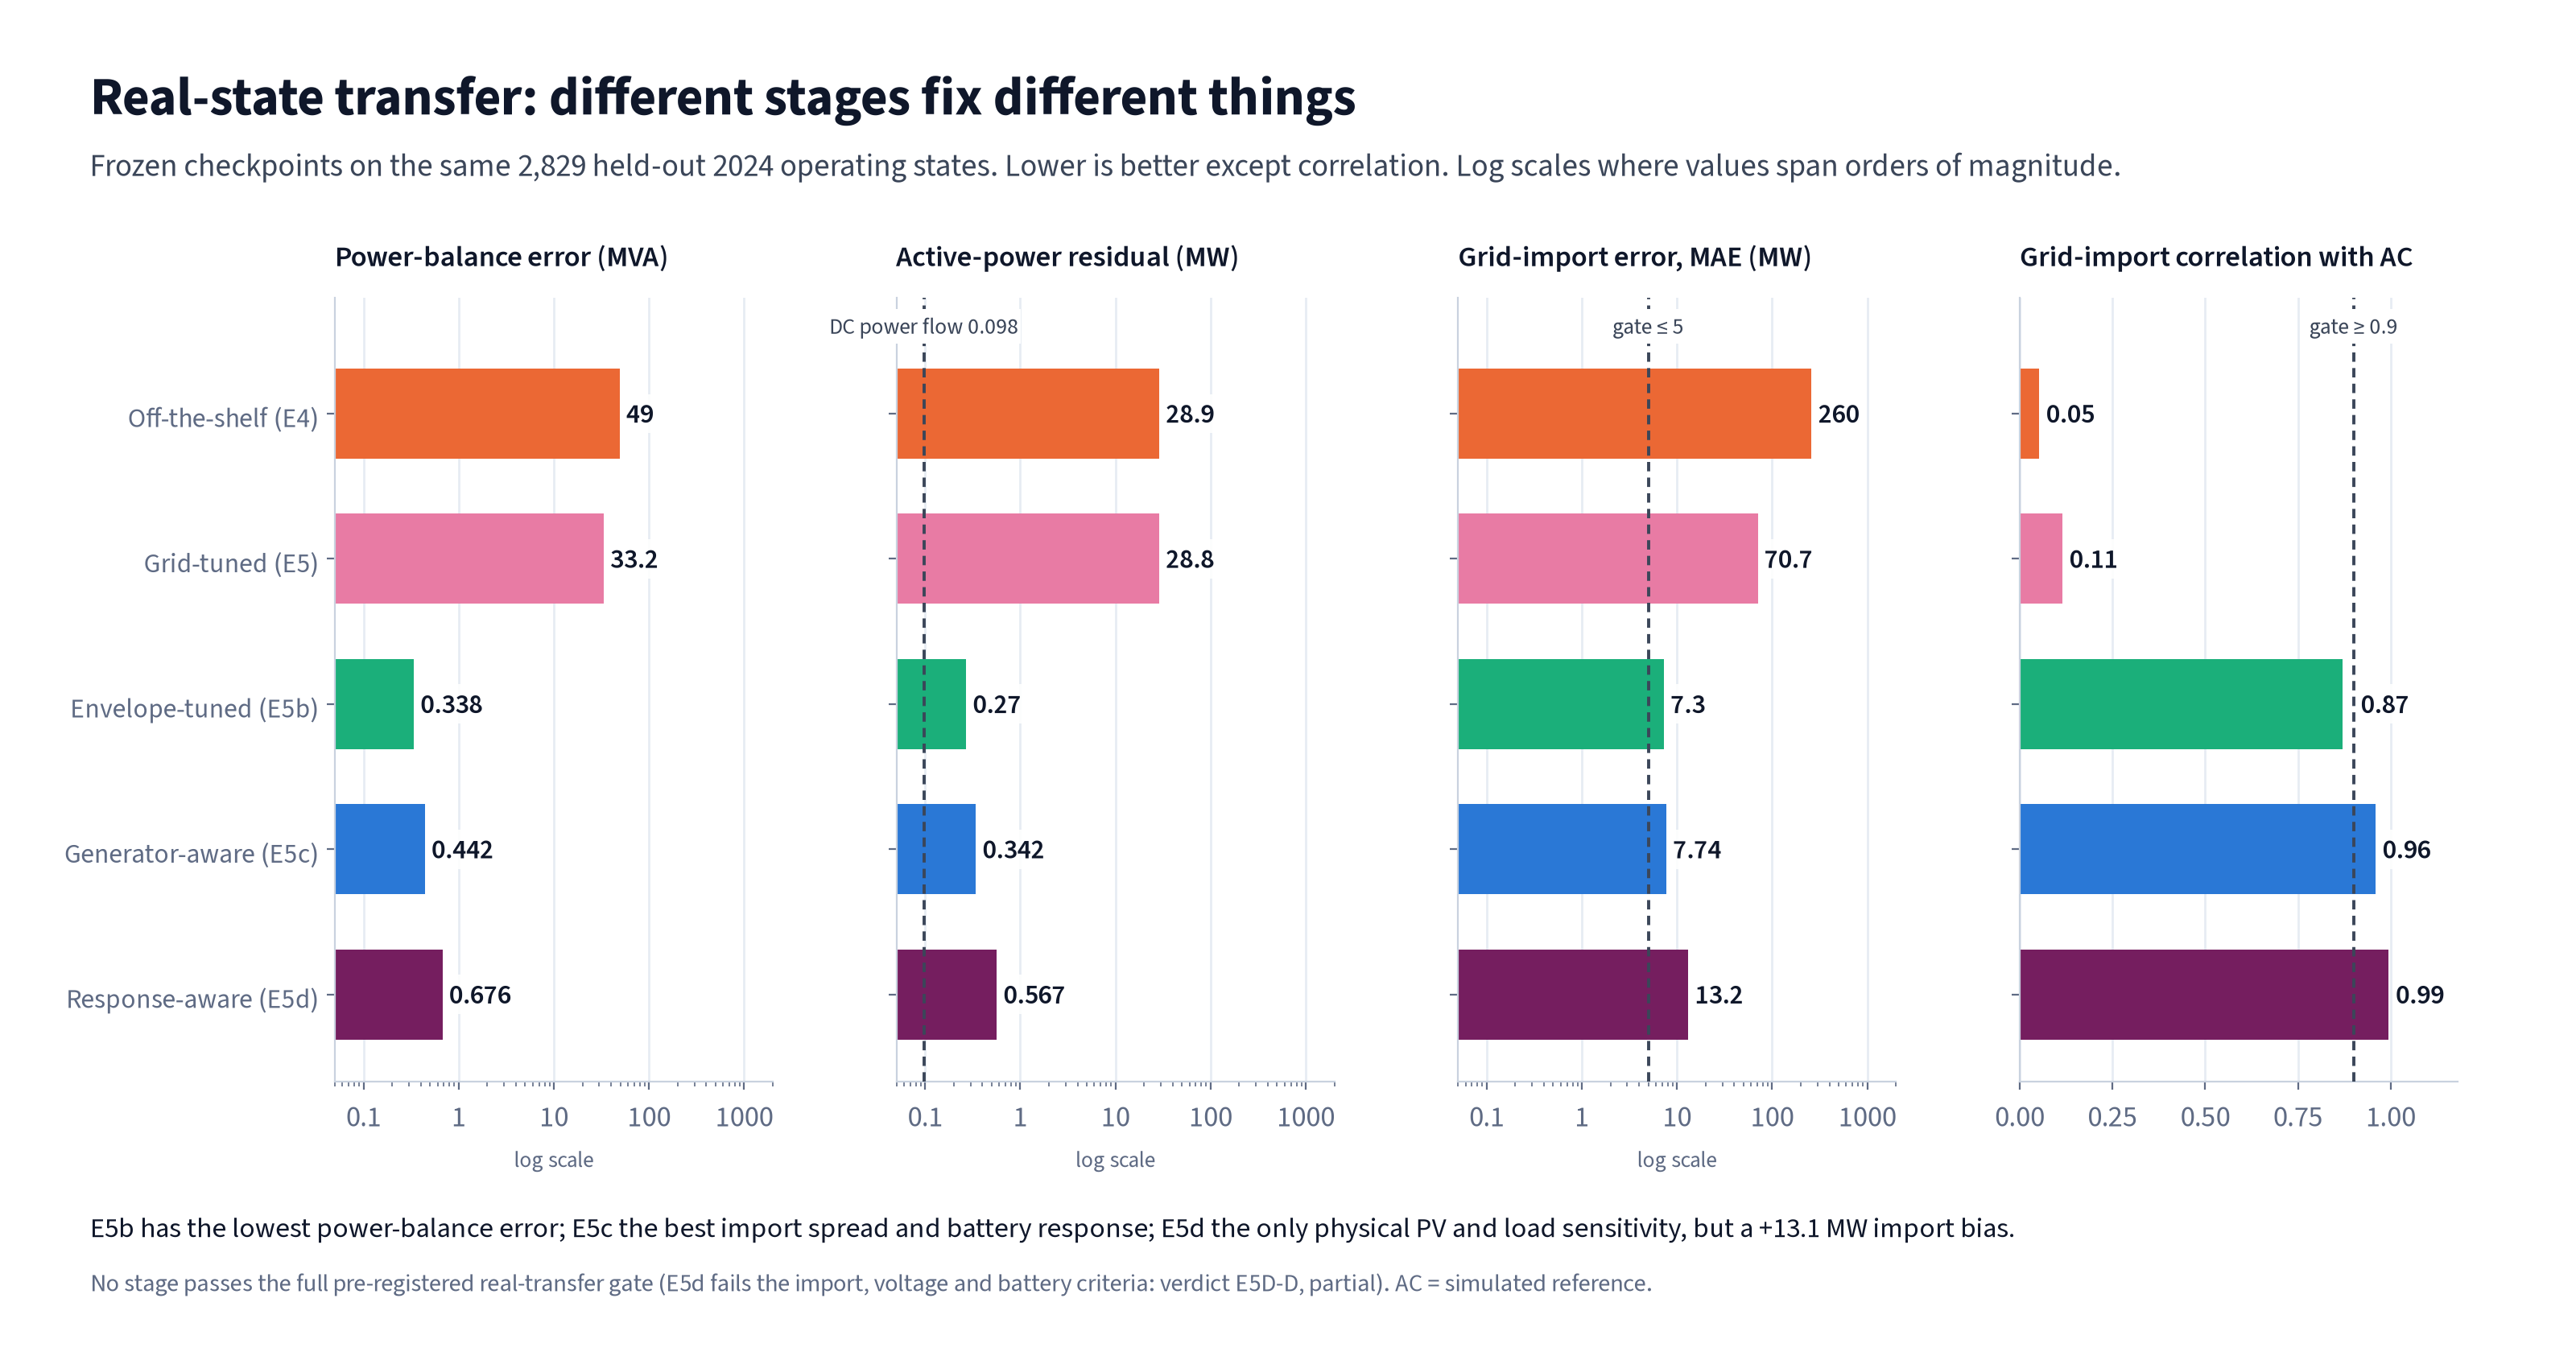
What the results support:
- Response supervision was the decisive change for the PV sensitivity in our setting. It taught GENCO a renewable-generation sensitivity entirely from synthetic AC solutions, and, for the selected seed, that sensitivity transferred to unseen 2024 operating states, whereas ordinary generator-aware adaptation (E5c) achieved only −0.04 MW per MW. An identical run without it remained insensitive to PV on held-out synthetic pairs.
- Coverage matters. Broader synthetic operating-envelope coverage substantially improved real-state accuracy in our experiments: −99 % error from E5 to E5b.
What the results do not support:
- Full transfer. The response-aware model's import is biased by +13.1 MW (MAE 13.2 MW), its voltage error (0.0109 pu) misses the 0.010 pu criterion, and its battery response overshoots (1.17 MW per MW, against 1.00). Its pre-registered verdict is E5D-D: partial.
- A single best model. States and sensitivities did not improve together: E5b is best on most absolute-state metrics (lowest power-balance error and import bias), E5c has the best battery response, and E5d the only physical PV and load sensitivity (with the lowest voltage-magnitude error and the highest import correlation).
- An operational model. E5d is a research model, not a validated operational one.
9. Why the absolute import remains biased: a post-hoc diagnostic
E5d reproduces the change in grid import closely but not its level. A post-hoc diagnostic (E6) on held-out synthetic states examines where the level error comes from. It is not pre-registered, no model was trained for it, and no real data were used.
- Power-balance accounting links the import error to accumulated nodal mismatches and network-loss differences. GENCO does not predict the import directly: GraphKit's power-flow decoder computes it from the predicted voltages, as the power flowing out of the substation. The import error therefore equals the difference in network losses plus the sum of the small power imbalances that the predicted voltages leave at the other 36 buses. This accounting is exact when every injection and loss term is included; recomputed from the frozen predictions, it closes within 0.06 MW in every state. The loss difference is small, so the import error is essentially the accumulated nodal mismatch. These imbalances share a sign and accumulate: predicted import ≈ 21.1 + 0.62 × true import, a 14.2 MW mean error.
- Paired supervision carries almost no signal about this error (observed). The two states of a pair carry almost the same error (r = 0.999 for PV pairs), so it cancels in their difference, which is the quantity the response loss supervises: 11.7 MW error in each state, 0.05 MW in the PV-induced change. The ordinary objective penalises the mismatch at each bus, but not explicitly their sum.
- Interpretation. This mechanism helps explain why response supervision improved the sensitivity without calibrating the level; establishing it as the complete cause would need an intervention.
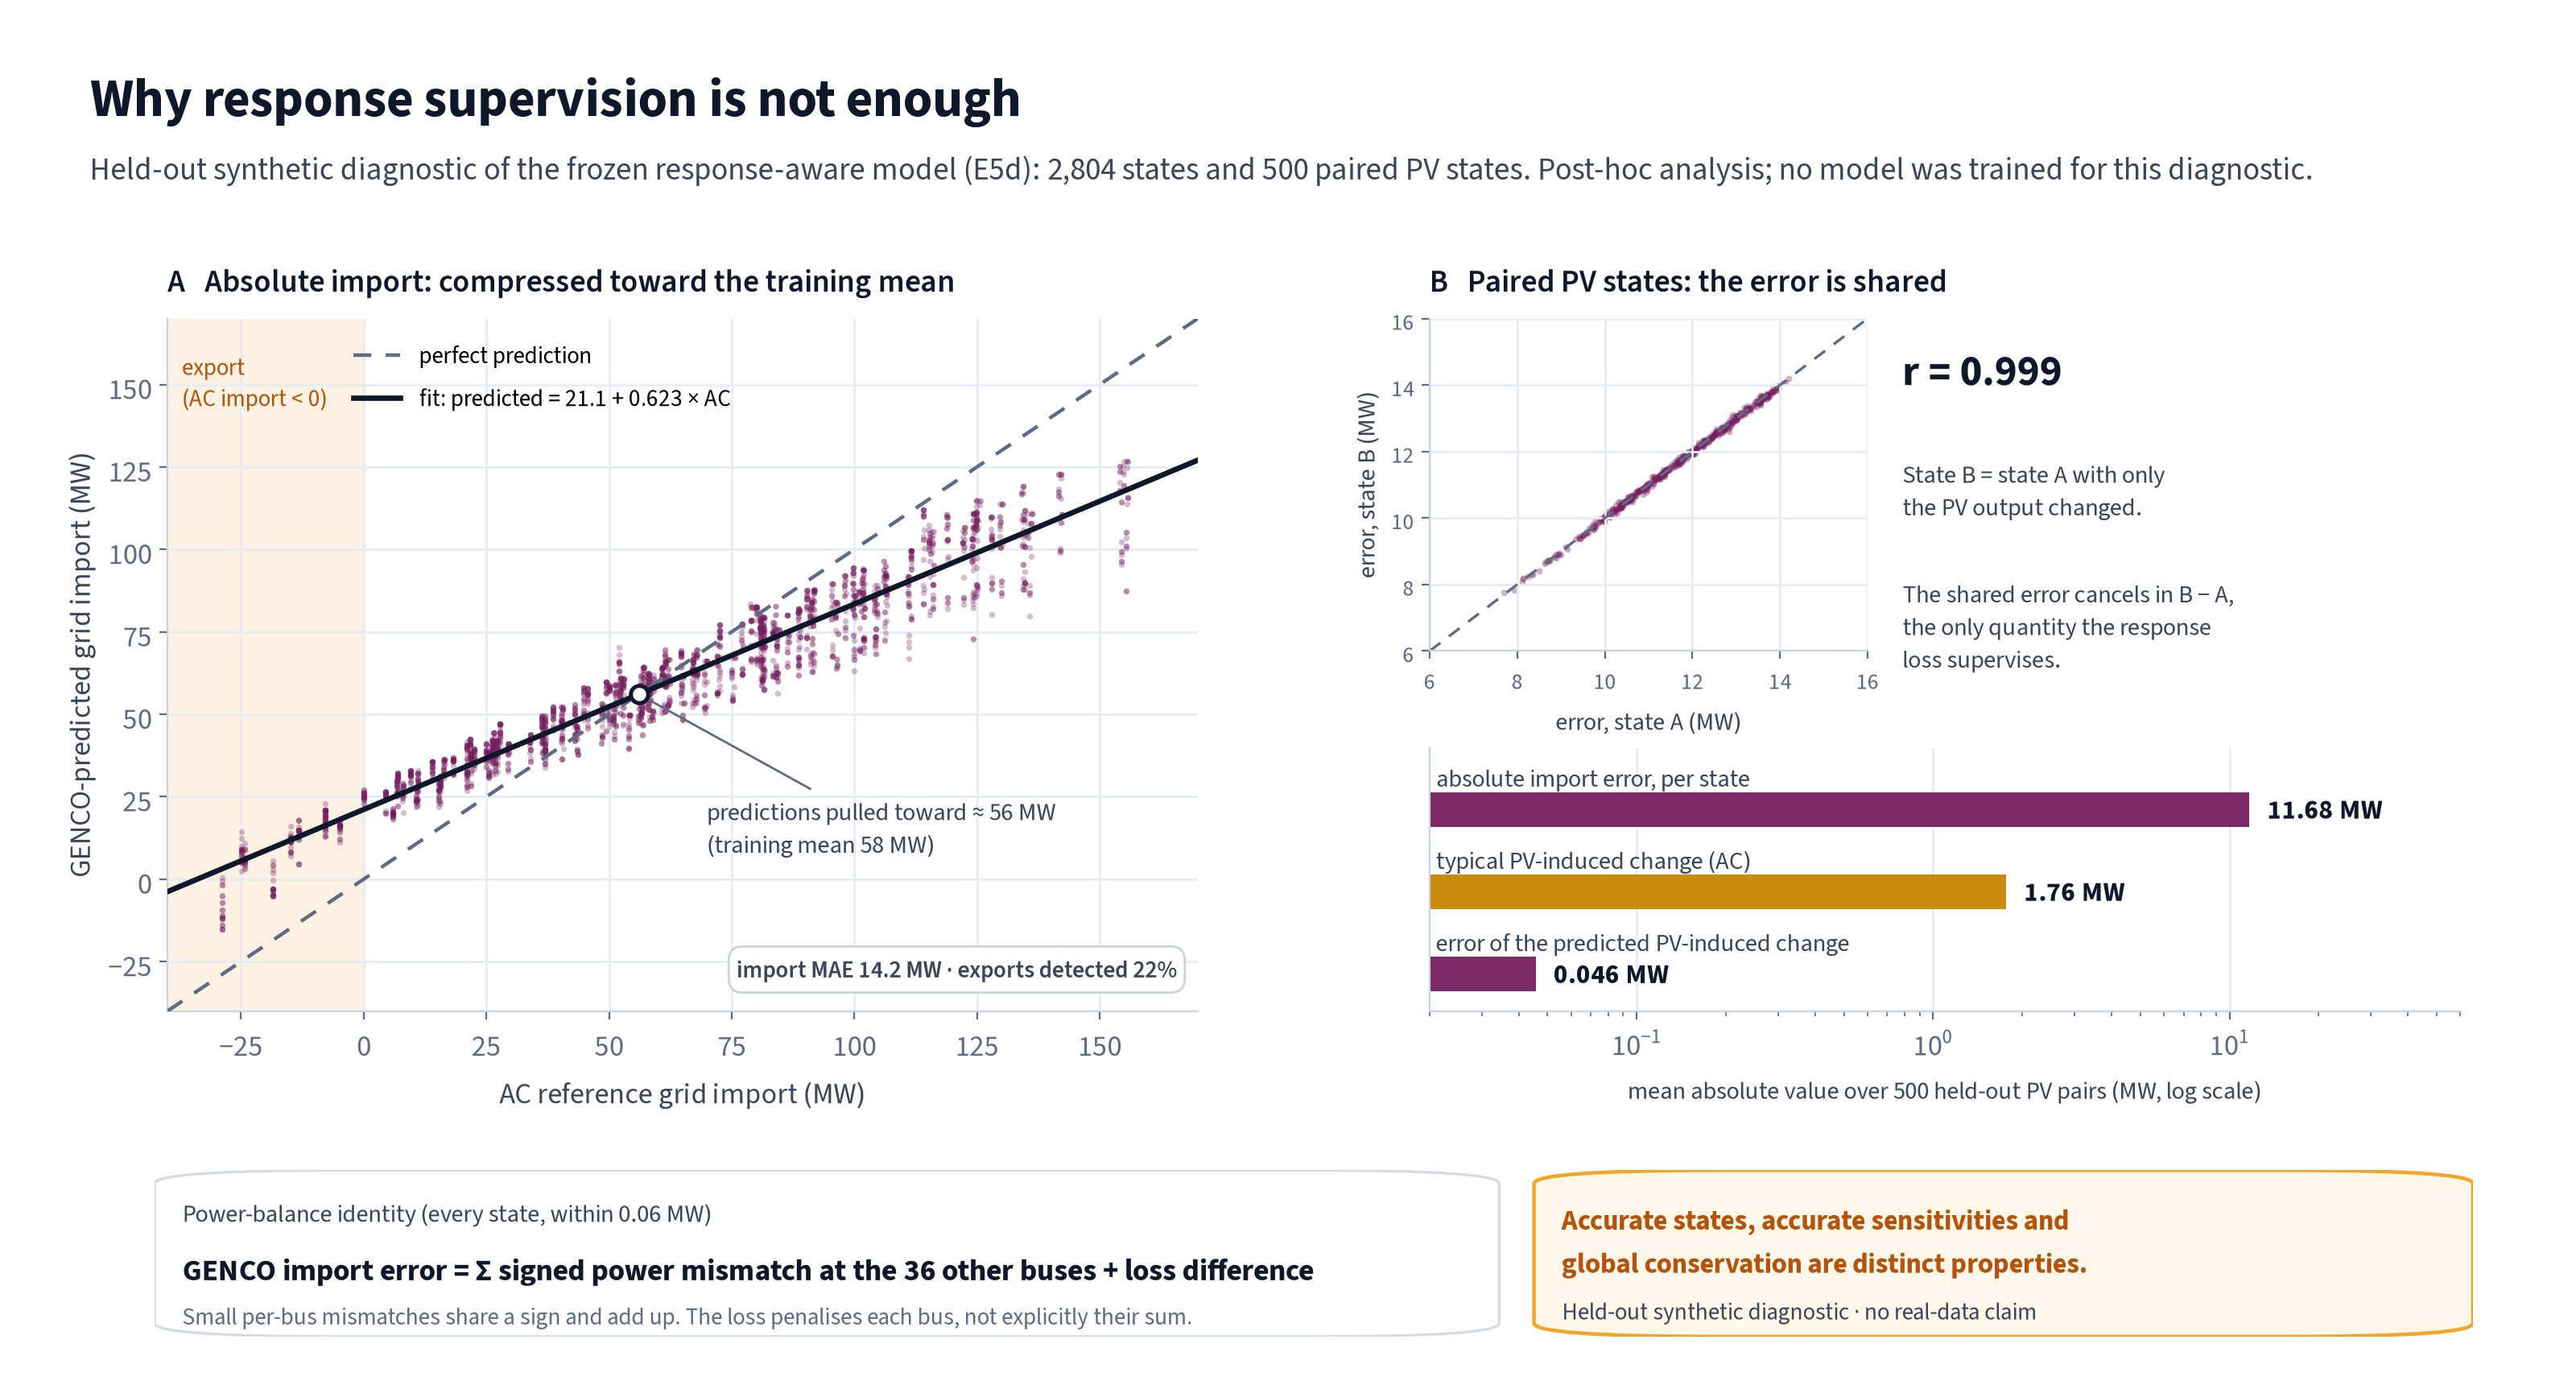
The lesson: in our experiments, accurate electrical states, accurate physical sensitivities and global physical conservation behaved as distinct model properties. Good performance on one did not guarantee the others. A simple sum of the known injections reproduces the import within 0.6 MW, but that bypasses the learned model rather than improving it.
→ Diagnostic details: reports/e6_feasibility_diagnostic.md
10. Second-network synthetic replication; real-data validation remains open
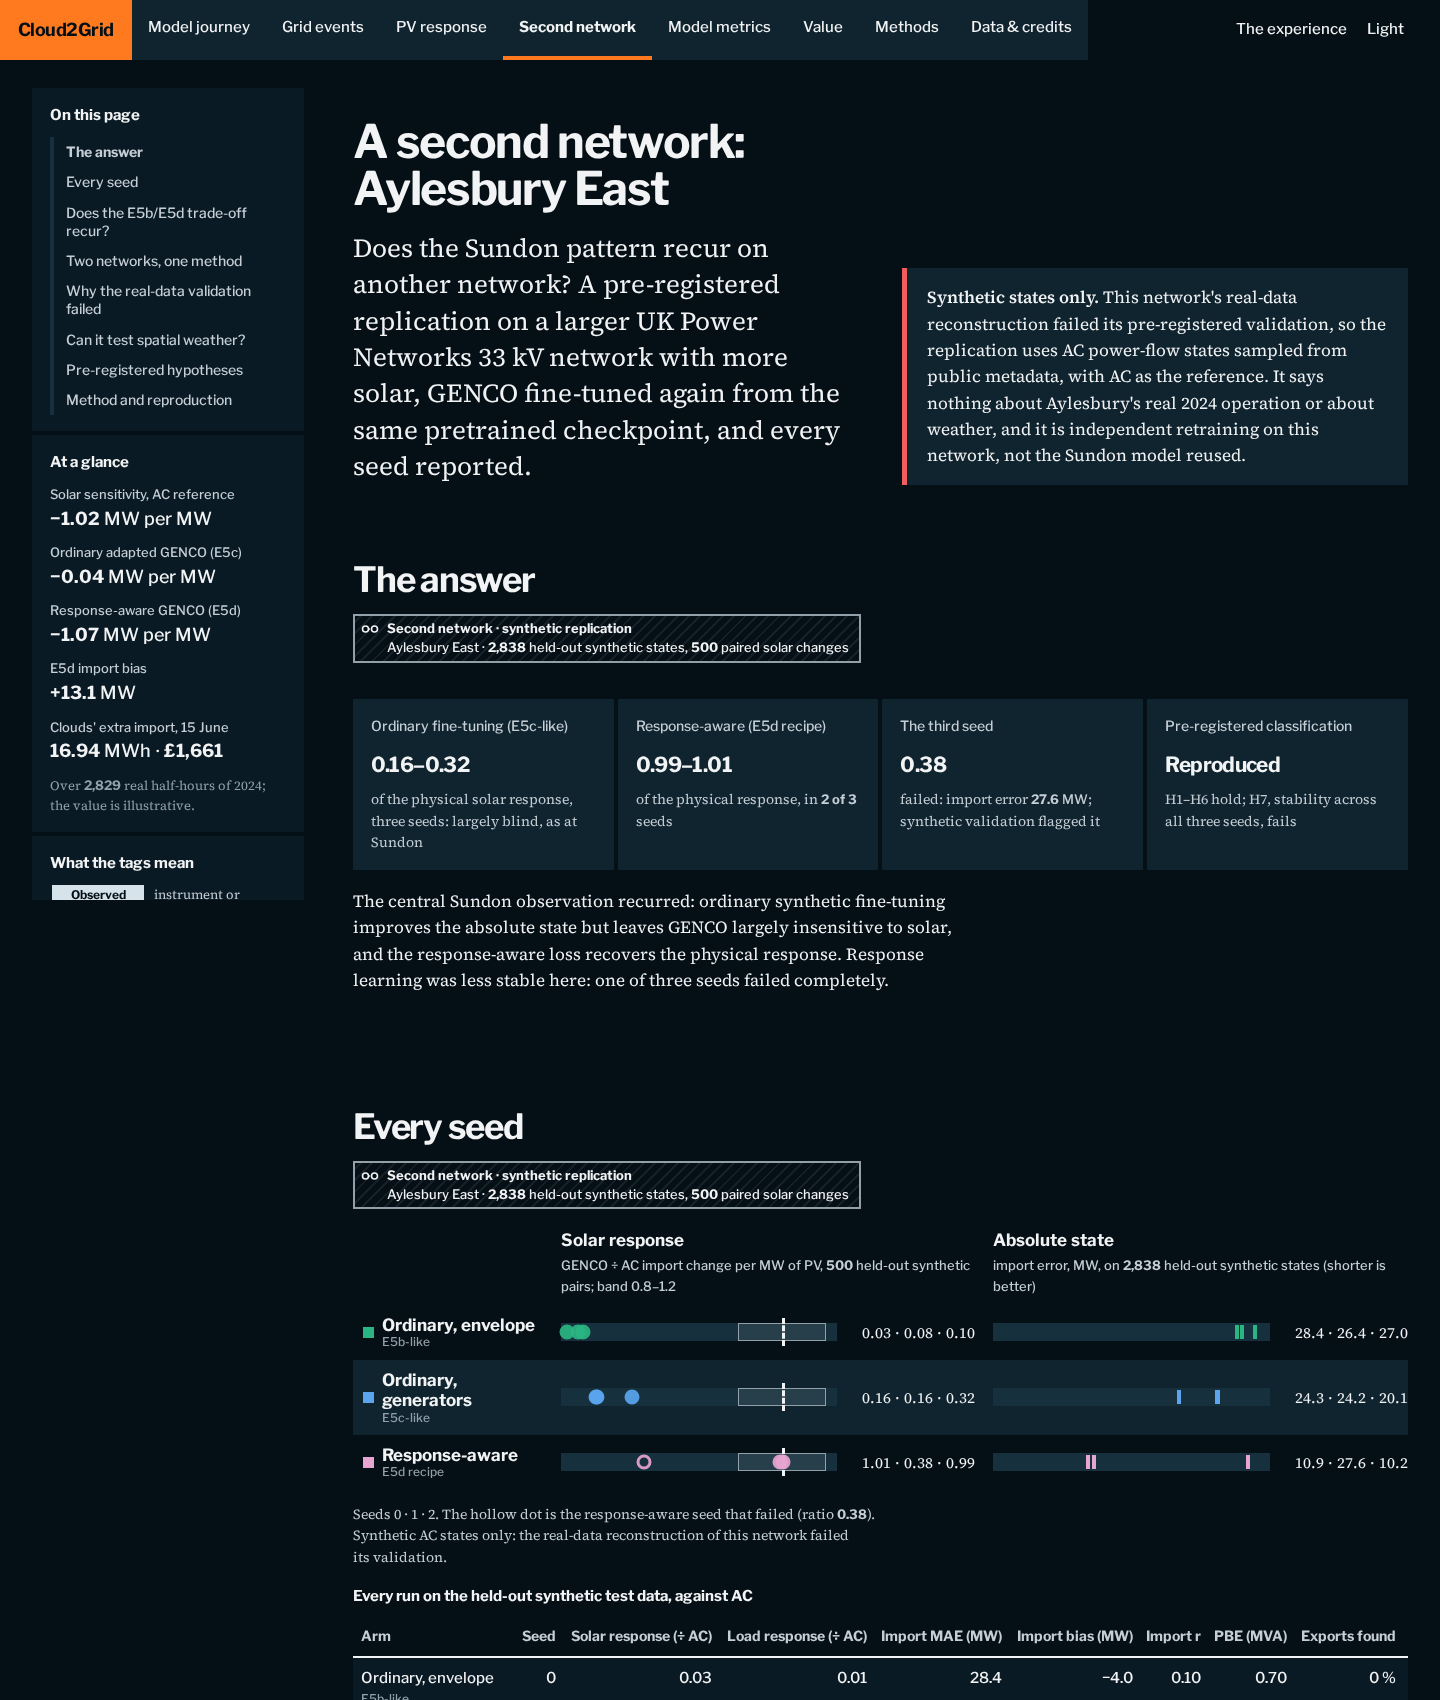
Is the Sundon result specific to one network? We repeated the adaptation study, pre-registered, on a second UK Power Networks 33 kV network, Aylesbury East: 56 buses, reconstructed with the same code, and 39.5 MW of solar plus 3.0 MW of wind represented in the synthetic evaluation. GENCO was fine-tuned again from the same pretrained checkpoint on this network's own synthetic AC states, with three seeds per arm. This is network-specific adaptation, not zero-shot transfer of a Sundon-trained model.
- A synthetic AC replication only. The reconstruction of Aylesbury East's historical operation failed its pre-registered validation (1 of 6 core circuits met the fit, and one grid-transformer section flowed the opposite way), so the real-state study was stopped before any training. The results below are on held-out synthetic states (2,838) and paired solar changes (500).
- The response result replicated. Ordinary generator-aware adaptation recovered 0.16–0.32 of the AC solar response; response-aware training recovered 0.99–1.01 in two of three seeds. The third seed failed (0.38), so the pre-registered seed-stability criterion failed.
- Sundon's exact E5b/E5d trade-off did not replicate in the same form. On this network, the successful response-aware seeds were also more accurate on the absolute state than ordinary adaptation (import MAE 10.2–10.9 MW, against 20.1–24.3 MW), yet a substantial, sign-coherent absolute import error remained. The shared result is that response-aware training recovered the physical sensitivity while meaningful absolute-state errors remained.
- Spatial cloud effects could not be evaluated. In the separate real-data check, 96 % of the network's 41.2 MW of active solar sits in one native satellite pixel. That check also found only about −0.51 MW of measured import per MW of satellite-estimated solar: an exploratory, post-hoc association, not a validated causal response.
→ Second-network report: reports/g2/SECOND_NETWORK_REPORT.md
11. From clouds to an illustrative value: one 6 MW plant
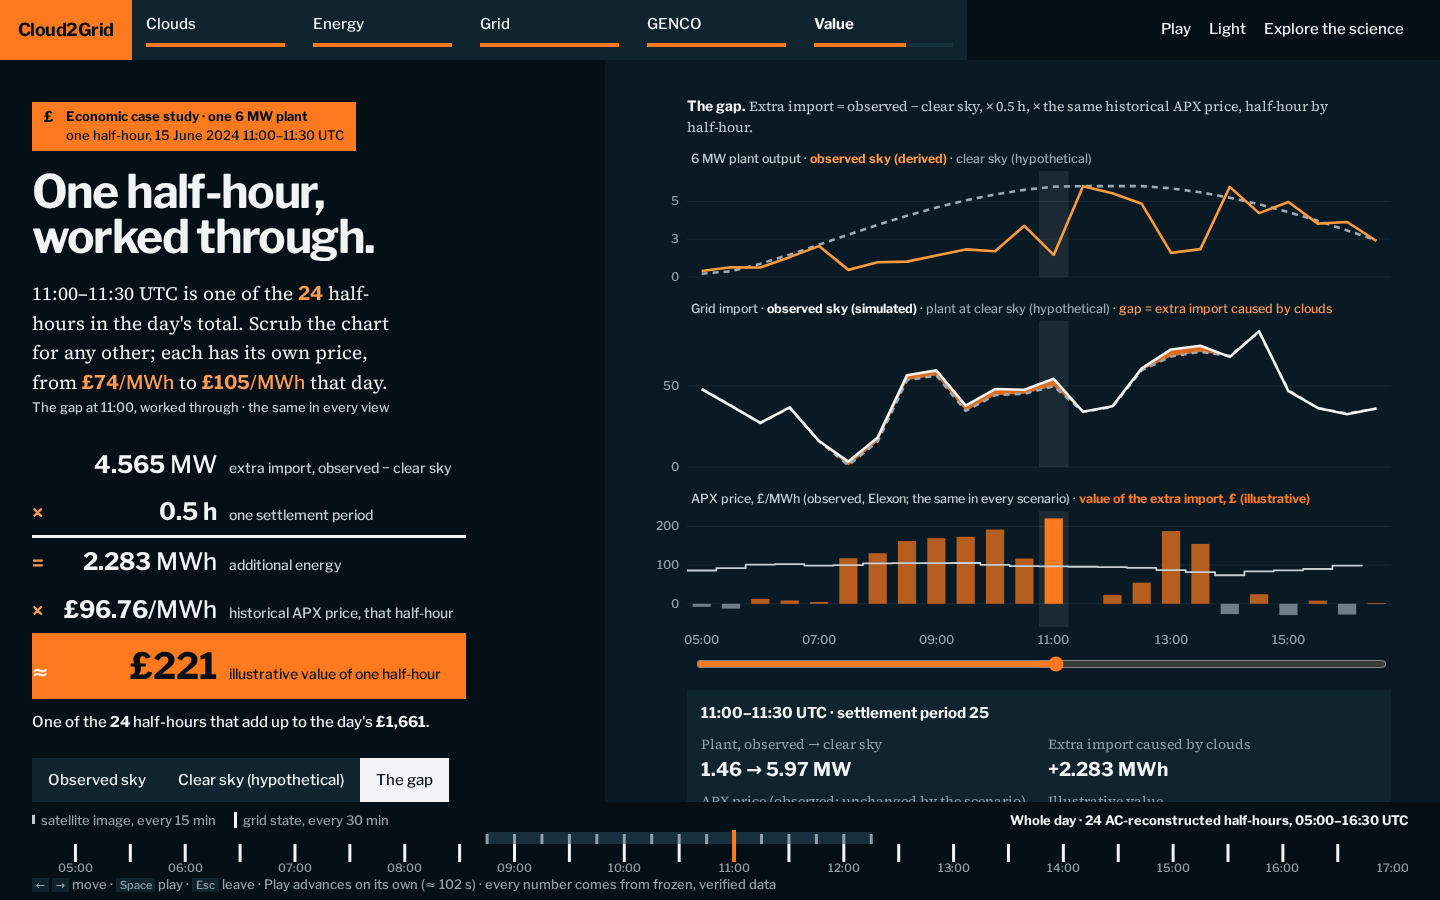
The website's Value chapter turns reconstructed import changes into an illustrative value for one explicit 6 MW solar plant, using historical half-hourly Elexon APX prices. The other 2.9 MW of local PV sits inside the metered loads and is never varied. Two counterfactuals answer two different questions:
| Question | Compared | 15 June 2024 | April–September evaluated sample |
|---|---|---|---|
| Extra import caused by clouds | observed satellite-derived output against a hypothetical clear-sky estimate | 16.94 MWh, £1,661 | 1,428.37 MWh, £93,286 (net) |
| Import displaced by the plant | observed output against no plant | 31.24 MWh, £2,890 | 4,038.08 MWh, £234,226 |
- A signed, net valuation over an incomplete season. The sample is 2,820 evaluated half-hours on 136 days, with APX prices for 2,819 of them (the missing price's energy is counted and its value omitted). £93,286 is the net illustrative valuation across the evaluated periods, including negative contributions and negative market prices. In 927 half-hours the satellite-derived output exceeded the modelled clear-sky estimate, which can reflect cloud enhancement or a disagreement between the two estimates; 180 half-hours had negative prices.
- How the methods compare (against AC, all 2,820 half-hours). Response-aware GENCO's (E5d) totals are within 0.3 % (plant against no plant) and +0.06 % (clouds); ordinary adaptation (E5c) misses 98 %; lossless injection accounting is within 1.5 %. E5d's close totals partly reflect positive and negative errors that cancel. Per half-hour, simple accounting is more accurate: clearly for the cloud effect (mean absolute error 0.018 against 0.041 MW, closer in 77 % of half-hours), narrowly for the plant's contribution (0.042 against 0.049 MW, closer in 54 %). Pricing E5d's absolute import instead would overstate the value of all imported energy by 27 %.
- Illustrative, not financial. These are retrospective valuations of AC-reconstructed energy at a national wholesale index, not measured losses, savings, tariffs, bills, nodal prices or forecasts. GENCO does not predict prices. Nothing is extrapolated to other days, plants or networks, and no value is computed for the second network.
→ Economic study (pre-registered method, data sources, verification): reports/economic_impact/
12. Explore it yourself
👉 Cloud2Grid: Guided Experience and Scientific Explorer
One web application, open in any browser with nothing to install. Every figure on it is exported from the frozen data bundles and labelled with its provenance (observed, satellite-derived, AC-reconstructed, GENCO-predicted or hypothetical) and its evaluation scope.
Guided Experience. Five chapters on one real day, 15 June 2024: Clouds → Energy → Grid → GENCO → Value. They run from real Meteosat images of a cloud deck clearing, through the satellite-derived output of the local solar fleet and the AC-reconstructed network response, including a controlled counterfactual at 11:00 in which only one 6 MW plant changes. They continue with GENCO's adaptation from the original checkpoint to the response-aware stage, and end with an illustrative valuation for that plant. Visitors move on with Next, or press Play.
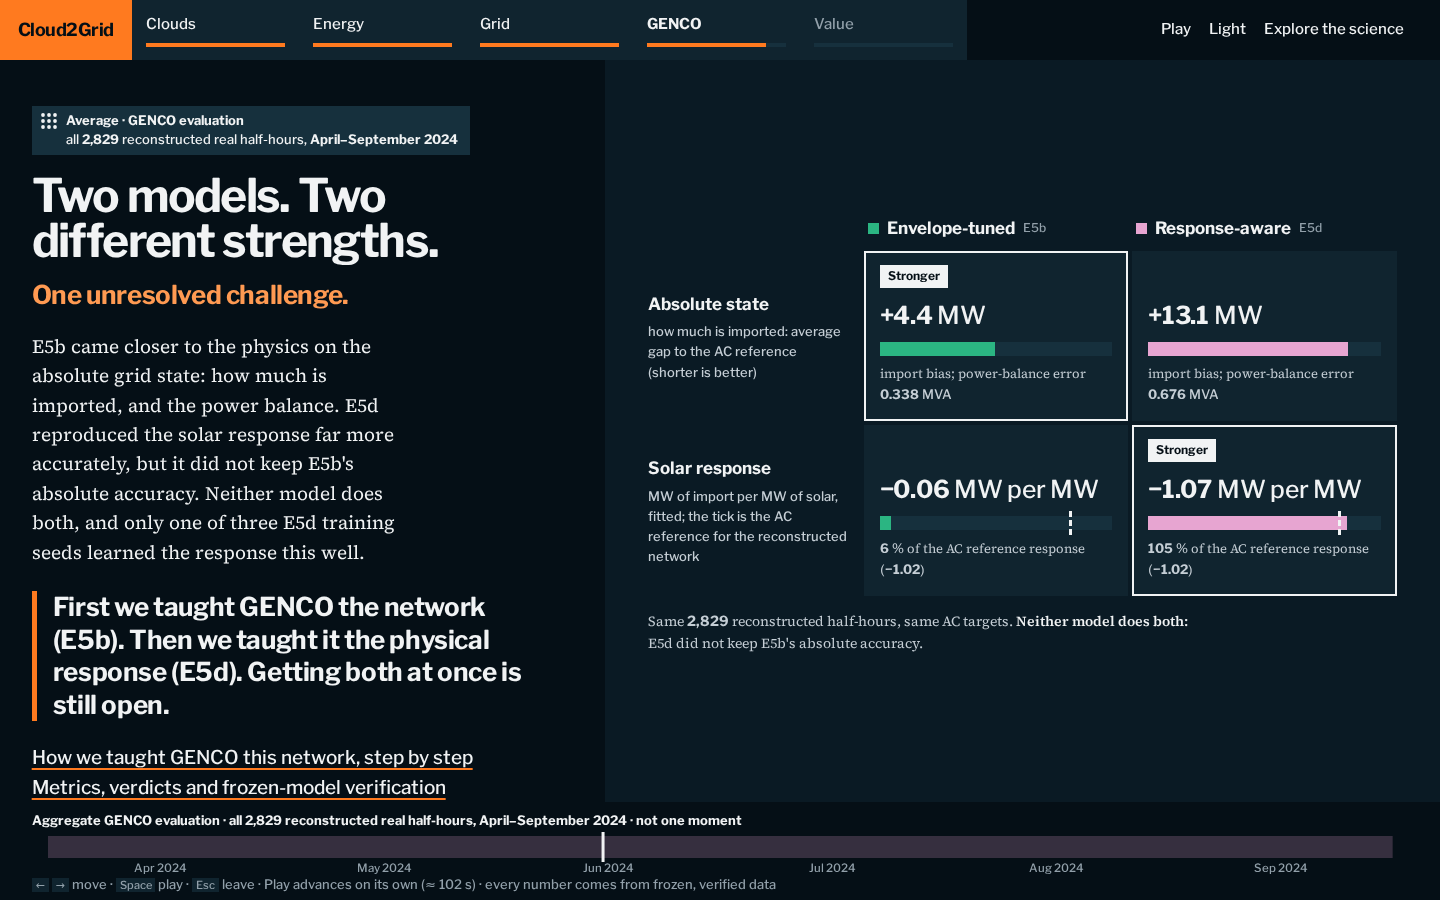
Scientific Explorer. The model journey stage by stage; the PV response across the 2,829 reconstructed states; model metrics with day-block confidence intervals; three weather events with the AC reference and each GENCO stage; the second-network synthetic replication with every seed; the economic study with both counterfactuals kept apart; and data, licences and provenance.
- 🌐 Open the website · 💻 Source code · 🔁 Reproduce the models · 📦 Frozen models and verification data
- 🤗 On Hugging Face: E5c model · E5d model · synthetic verification dataset · base checkpoint
gridfm/genco-pf-transfer
13. Frozen models and independent verification
The frozen checkpoints and a held-out verification set are published as a GitHub Release, cloud2grid-models-v1, and, with the same files and checksums, on Hugging Face:
| Hugging Face | Licence | |
|---|---|---|
| E5c, ordinary generator-aware adaptation (weak solar response) | oriolh/cloud2grid-e5c-ft-n10000-s2 |
Apache-2.0 |
| E5d, response-aware adaptation | oriolh/cloud2grid-e5d-l1-s0 |
Apache-2.0 |
| Synthetic verification data | oriolh/cloud2grid-verification-synthetic-v1 |
CC BY 4.0 |
Anyone can re-run the main synthetic finding with real inference, from the GitHub Release:
git clone https://github.com/hinox13/grid2cloud
cd grid2cloud
uv sync --extra genco
uv run python reproduce/verify_models.py
or from Hugging Face, anonymously and pinned to the v1 tag of each repository:
uv run hf download oriolh/cloud2grid-e5c-ft-n10000-s2 --revision v1 --include "release/*" --local-dir hf_assets
uv run hf download oriolh/cloud2grid-e5d-l1-s0 --revision v1 --include "release/*" --local-dir hf_assets
uv run hf download oriolh/cloud2grid-verification-synthetic-v1 --type dataset --revision v1 --include "release/*" --local-dir hf_assets
uv run python reproduce/verify_models.py --assets-dir hf_assets/release
- Released: the E5c and E5d checkpoints, each with its own normaliser, a model card and its SHA256; and public held-out synthetic verification data (1,500 AC-solved response pairs and 2,804 held-out states).
- What the script does: it runs real GraphKit inference with both checkpoints (no replay of stored predictions), cross-checks the results against the frozen predictions and the published tables, and reports which claims reproduce.
- Our fresh-clone checks passed on CPU and GPU: all five synthetic claims reproduced (E5c's weak PV response; E5d's PV recovery; E5d's battery and load responses; E5d's distributed responses; both models' remaining absolute import error), and 44/44 scored metrics within the stated tolerances. CPU inference is deterministic; GPU inference varies slightly between runs, and the tolerances account for it.
- Scope: this verifies the synthetic findings. The 2024 operating-state results above need operating data that are not in the release, so they are documented but cannot yet be independently recomputed.
→ Reproducibility and open-science details: docs/TECHNICAL_NOTES.md
14. Conclusions and research directions
The open GENCO checkpoint and the GridFM toolkits made it possible to run a complete, pre-registered adaptation study on a real network with synthetic training data only.
In our experiments, synthetic-only transfer of GENCO to a real distribution grid needed more than exposure to the target topology: synthetic data covering realistic operating regimes, and an objective that explicitly teaches physically meaningful sensitivities. Even then, accurate states, accurate sensitivities and global physical conservation behaved as distinct properties, which suggests reporting them as separate metrics and, potentially, giving each its own training signal.
Connecting Earth observation to energy applications. Initiatives such as Destination Earth's Weather-Induced Extremes Digital Twin, whose global component is developed by ECMWF, and AI4Clouds, which combines SEVIRI and FCI observations, ERA5 reanalysis and Extremes Digital Twin fields, show how simulations, reanalysis and satellite data can be fused into more useful environmental information. In a broader energy value chain, such information could support renewable-generation forecasts, and validated network models could assess their implications for power flows, constraints, storage and flexibility. These are independent examples, not components of Cloud2Grid: this study investigates the grid-response part, does not use their derived products, and does not implement weather forecasting or operational optimisation.
Limitations, stated plainly:
- Full transfer is not achieved. No stage passes the complete pre-registered real-transfer gate. E5d is not a validated operational model.
- The 2024 results are not independently reproducible yet. The release reproduces the synthetic findings only.
- Seed stability. Response-aware training varied strongly across seeds: on the 2024 states the two other λ = 1 seeds reached 0.68 and 0.80 of the AC reference response, and on the second network one of three seeds failed. Selection used synthetic criteria only.
- The AC reference is reconstructed physics, not a measured response. The −1.02 MW per MW is the reconstructed network's modelled response to the injected satellite-derived PV estimate. That estimate was not compared with metered plant output, and Sundon's operational validation found only a small solar signature in the measured import (a midday dip of about 1.2 MW relative to night in May–August, with the battery idle). Satellite observations, satellite-derived PV estimates, reconstructed AC states, hypothetical clear-sky counterfactuals and GENCO predictions are labelled separately throughout; none of them is measured network behaviour.
- The weather question is unresolved. The pre-registered weather test runs only after full transfer succeeds, so we make no claim either way about weather's effect on GENCO.
- One satellite pixel per network. Sundon's 2024 PV of 1 MW and above sits in one satellite pixel, and 96 % of Aylesbury East's active solar in one pixel, so spatial weather structure could not be tested.
- Economic values are illustrative. They value energy at historical national APX prices for one 6 MW plant, with everything else held fixed, over an incomplete sample of half-hours. A public clone re-checks their arithmetic from the released per-half-hour table, but not the AC counterfactual solves.
- Generator encoding. From E5c on, our representation places the Leighton Buzzard generators on PQ buses, so their generation is omitted from the model's internal physics feedback (§7). Evaluation uses the correct generation values, so the reported metrics stand, but the effect of correcting it is not assessed in the results reported here.
Research directions these results point to:
- Joint physical consistency: approaches that improve nodal and network-wide power balance while preserving accurate renewable-generation responses and absolute-state predictions, with our generator representation corrected and assessed separately, and any gain confirmed on an untouched real evaluation period.
- Calibration of the absolute import: on held-out synthetic states the adapted import is compressed toward about 56 MW, so the representation and conditioning of the slack injection are concrete levers.
- Real-data replication: the synthetic replication on Aylesbury East is complete (§10). Still needed is a second network with validated historical operation and solar distributed across several satellite pixels, to test real transfer and whether spatial weather structure matters.
Team, acknowledgements, contact and licences
- 👤 Team: Oriol Hinojo
- ✉️ Contact: open an issue · GitHub @hinox13 · Hugging Face @oriolh
- 🙏 Acknowledgements: Cloud2Grid builds on GENCO (Puech et al., 2026) and the open GridFM ecosystem: the
gridfm/genco-pf-transfercheckpoint, gridfm-graphkit for fine-tuning and inference, and gridfm-datakit for synthetic AC data. Every adaptation step here used them. We also thank UK Power Networks, EUMETSAT / LSA SAF and Elexon for their open data, and the pandapower, PowerModels and pvlib projects. - 🌐 Website · 💻 Code · 📦 Models · 🔁 Reproduction
Contains modified EUMETSAT Meteosat and LSA SAF data (CC BY 4.0) and UK Power Networks data (CC BY 4.0), which include ONS data (OGL v3.0) and OS data © Crown copyright. Contains BMRS data © Elexon Limited copyright and database right 2024. GENCO / gridfm: Apache-2.0. Cloud2Grid code and released weights © 2026 Oriol Hinojo, Apache-2.0; verification data CC BY 4.0. Third-party data keep their own licences and are not redistributed; per-source attribution: docs/DATA_LICENSES.md and NOTICE.